DORA metrics are the software delivery performance measures defined by the DevOps Research and Assessment (DORA) program, a long-running research initiative now part of Google Cloud. The well-known four are deployment frequency, lead time for changes, change failure rate, and failed deployment recovery time (formerly "time to restore service") - though DORA now tracks five software delivery metrics, having added deployment rework rate. Some capture throughput - how fast a team ships - and others capture stability - how reliably it ships. Teams use them to benchmark delivery performance and find where to improve. The metrics come from DORA's annual report, which has surveyed tens of thousands of professionals since 2014 and was renamed in 2025 from the Accelerate State of DevOps Report to the State of AI-assisted Software Development report - a signal of how completely AI now dominates the research. This guide reflects DORA's 2025 trilogy of reports and its January 2026 ROI study.
The Four Key DORA Metrics
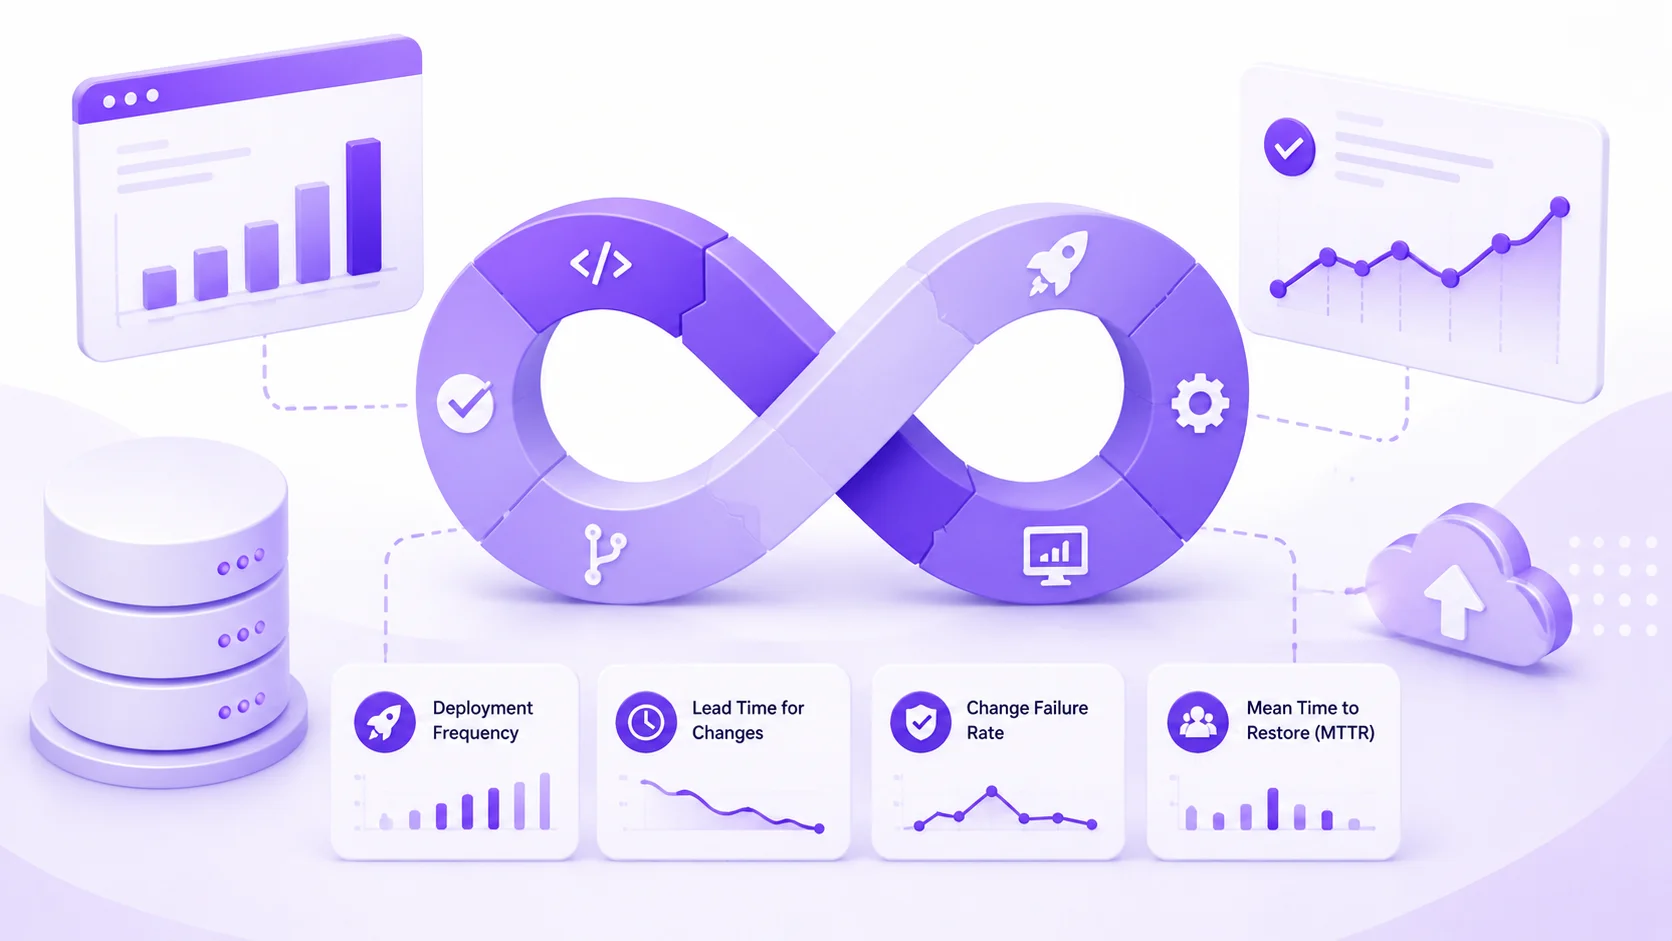
Each metric answers a specific question about the path from a code change to running production software. DORA groups them into throughput (speed) and stability (reliability).
Deployment frequency measures how often an organization successfully releases code to production. Higher frequency usually reflects smaller batch sizes, which lower the risk of any single deployment.
Lead time for changes (also called change lead time) measures the time from a commit being merged to that change running in production. It captures the efficiency of the build, test, and release pipeline, not the time spent writing the code.
Change failure rate (DORA's current term is "change fail rate") is the percentage of deployments that cause a failure in production requiring remediation - a rollback, hotfix, or patch.
Failed deployment recovery time measures how long it takes to restore service after a deployment-caused failure. This metric was renamed in the 2023 report from "time to restore service" (and earlier MTTR, mean time to recovery). DORA made the change to distinguish failures triggered by a software change from failures caused by external factors like a data-center outage. The 2024 report moved it from the stability group into the throughput group, on the reasoning that fast recovery supports delivery flow. The full rationale is documented in DORA's metrics history.
Four metrics or five?
DORA now formally tracks five software delivery performance metrics, grouped into throughput and instability:
- Throughput: deployment frequency, change lead time, and failed deployment recovery time.
- Instability: change fail rate and deployment rework rate - the share of deployments that are unplanned and happen as a result of a production incident (a rollback, hotfix, or patch outside the normal flow).
Deployment rework rate was the fifth addition, and it has become especially relevant in the AI era: when teams ship more code faster, the question is how much of that volume comes back as unplanned remediation. Separately - and often confused with the fifth delivery metric - DORA added reliability back in 2021 as an operational performance measure covering availability, latency, and performance of running software. The original four remain the most widely cited, but rework rate is worth tracking precisely because it is where AI-accelerated delivery tends to show strain first.
Performance Benchmarks: a moving target
For years DORA sorted respondents into Elite, High, Medium, and Low clusters using statistical analysis, and that four-tier framing is still the one most people reach for. But it was never a fixed grid - the thresholds were recomputed from each year's survey, so they drifted annually, and DORA's primary reports never published a single clean table of cutoffs. The point figures that circulate (elite change failure rate around 5%, and so on) come largely from secondary analyses, and they vary: estimates for high performers' change failure rate range from roughly 10% to 20%.
More importantly, DORA's recent research has moved away from a single linear ranking. Rather than collapsing a team into one label, the current guidance is to read each of the five metrics on its own and to think in terms of team profiles shaped by throughput, instability, and team well-being together - because, as the AI findings below show, a team can now be fast and unstable at the same time. The rough bands below are still useful orientation, but treat them as legacy approximations rather than authoritative cutoffs:
| Metric | Strong | → | Weak |
|---|---|---|---|
| Deployment frequency | On-demand / multiple per day | Weekly to monthly | Less than monthly |
| Lead time for changes | Less than a day | A week to a month | More than a month |
| Change failure rate | ~5% | ~10-20% | Substantially higher |
| Failed deployment recovery time | Less than an hour | A day to a week | More than a week |
The deployment-frequency, lead-time, and recovery-time bands are the stable, well-established ones; the change-failure-rate figures are the least reliable and should be read as approximate.
What DORA's Latest Research Says About AI
AI now dominates DORA's research - enough that the 2025 annual report dropped "DevOps" from its name. The headline has also evolved quickly, so it matters which year you cite.
From "AI hurts delivery" to "AI, the great amplifier"
The 2025 *State of AI-assisted Software Development* report (September 2025) found, for the first time, a positive relationship between AI adoption and software delivery throughput, alongside gains in product performance - a reversal of the prior year's more pessimistic read, as teams learned where and how AI actually helps. By then roughly 90% of respondents used AI at work and over 80% said it boosted their productivity, even as about 30% reported little or no trust in AI-generated code.
The stability finding, however, did not flip: AI adoption still correlated with lower delivery stability - more change failures, more rework, longer recovery. DORA's framing for this is "AI, the great amplifier." AI accelerates whatever a team already does: teams with strong automated testing, mature version control, and fast feedback loops convert AI's extra change volume into faster delivery, while teams without those foundations see the same volume turn into instability. Independent engineering-telemetry analyses echo the split - many more pull requests merged, but longer review times and more incidents per PR.
The 2026 ROI report: foundations are the investment
DORA's January 2026 study, ROI of AI-Assisted Software Development (published May 2026), put numbers on the amplifier idea. Its central argument is that the biggest returns on AI come not from the tools but from the underlying engineering system - platform quality, clear workflows, and team alignment. The report models a first-year return of roughly $11.6M against an $8.4M investment for a 500-person engineering organization - about a 39% first-year ROI with an ~8-month payback - but only when the foundations are sound. Two findings stand out for delivery teams:
- The J-curve and the "verification tax." Organizations typically hit a productivity dip before gains arrive, driven by learning curves and the cost of reviewing AI-generated code - what DORA calls "the tuition cost of transformation." Time saved writing code is partly re-spent auditing it.
- Instability has a price tag. In DORA's sample model, a change failure rate rising from 5% to just 6% after AI adoption produced an estimated $344,000 in downtime cost - a direct line from the stability metrics to dollars.
Returns also depend on the work: cited research found AI delivers a 35-40% productivity gain on simple, greenfield tasks but often 10% or less on complex legacy code.
Seven capabilities that make AI pay off
Alongside the 2025 report, DORA published its first AI Capabilities Model (December 2025) - seven capabilities that amplify AI's benefits:
- A clear, communicated AI stance
- Healthy data ecosystems
- AI-accessible internal data (docs, codebases, decision logs)
- Strong version control practices and safety nets
- Working in small batches
- A user-centric focus
- Quality internal platforms
The thread through all of it: AI raises the volume and speed of change, so the disciplines that keep change safe - small batches, fast rollback, strong testing, quality internal platforms - are what separate teams that profit from AI from teams that just ship instability faster.
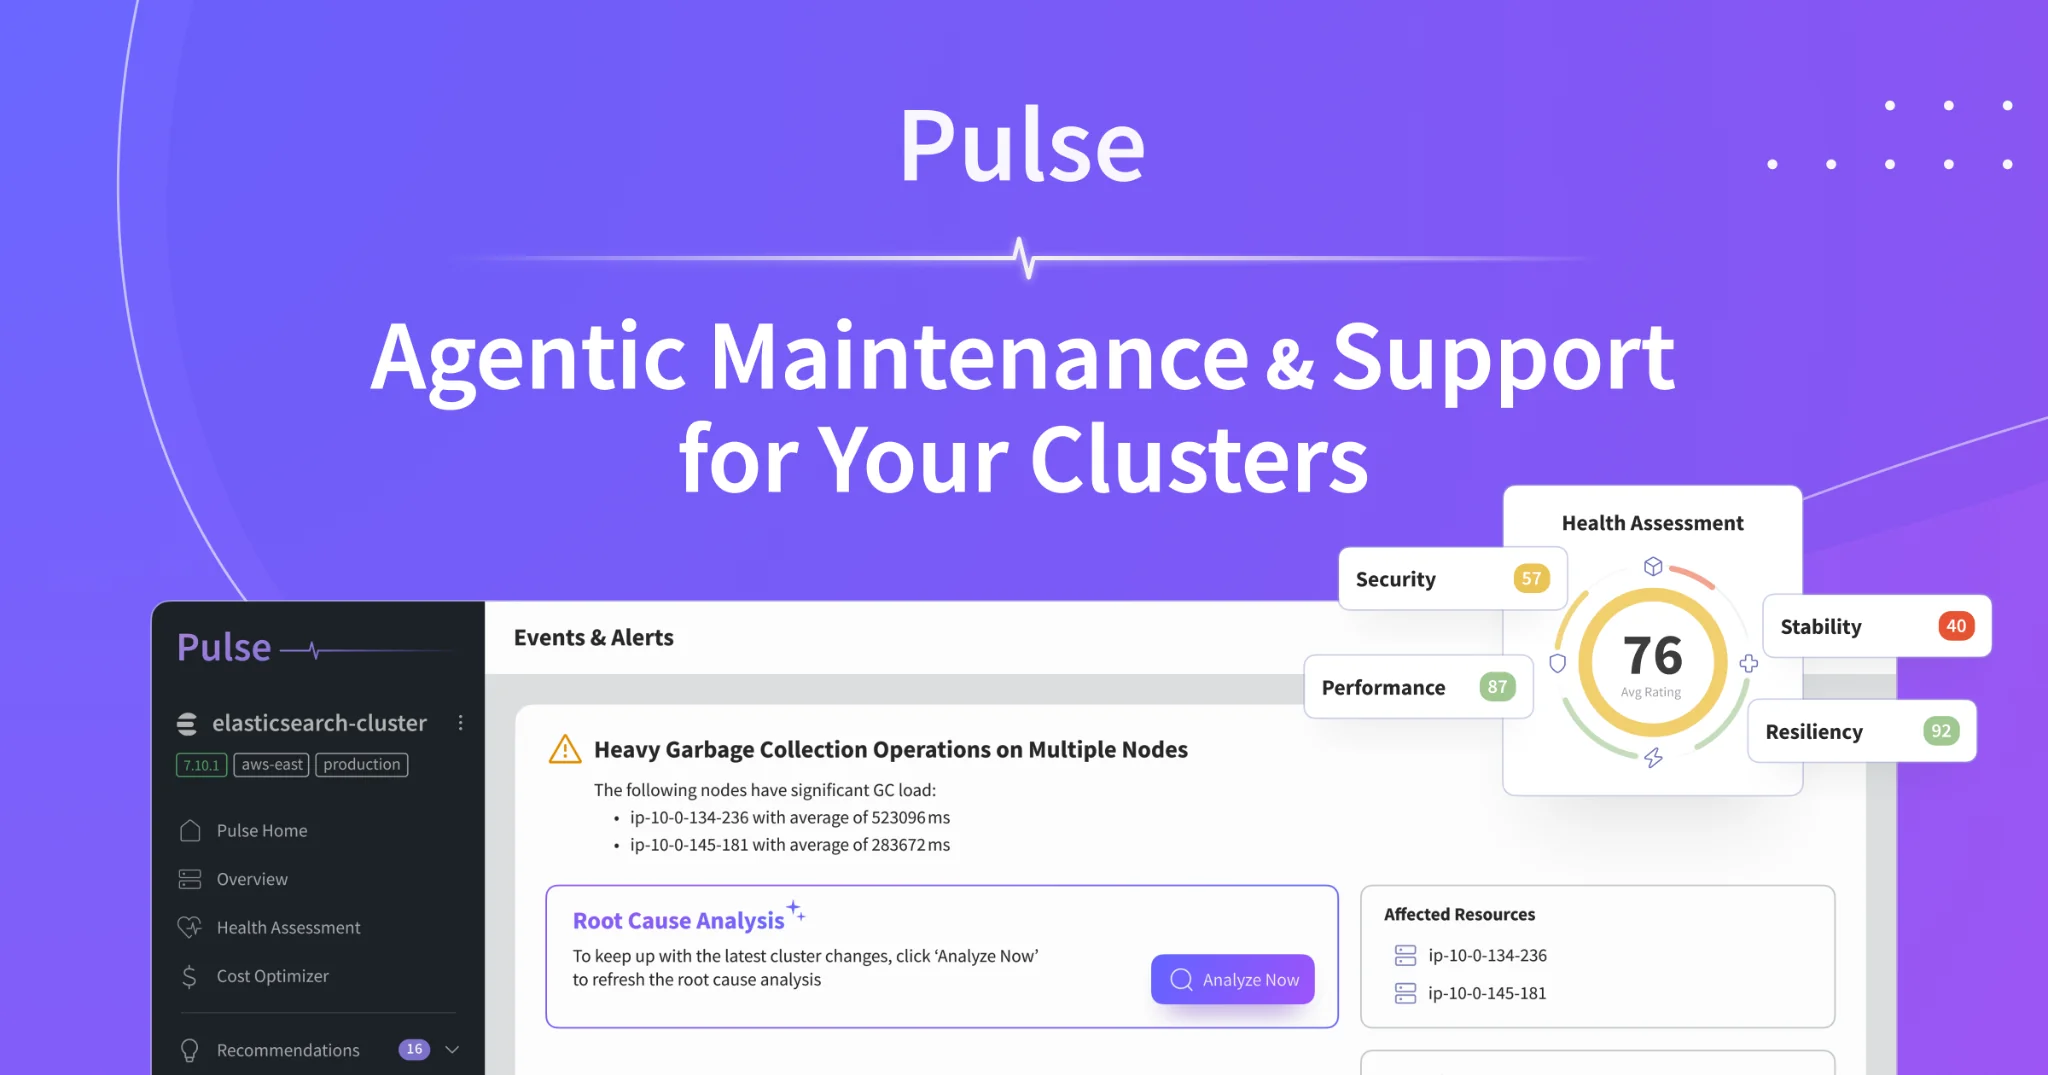
Where the database layer fits
Databases sit squarely in this instability story. AI-accelerated change means more schema migrations, more query changes, and larger batches landing on production data stores - exactly the changes that drive up change failure rate, deployment rework rate, and recovery time when something regresses. A migration that locks a table, a slow-query regression shipped with a release, or connection-pool exhaustion all surface as production incidents. Pulse is an AI-native database optimization and maintenance platform that acts as one of the safety nets DORA points to: it performs automated root-cause analysis on database incidents, so recovery time on a database-related failure is bounded by detection plus a pointed diagnosis rather than an open-ended hunt - and it surfaces regressions early, before a fast-moving AI-assisted pipeline turns them into rework. For DevOps teams, that is the verification tax paid where it bites hardest: the data layer.
How to Instrument DORA Metrics
You do not measure DORA metrics with a survey - you derive them from events your tools already emit. The pipeline has four stages.
Collect signals. Three sources cover all five metrics:
- Source control (PR and commit events): merge timestamps and commit SHAs feed lead time. A common signal set is "pull request created, code review created, comments added, pull request merged."
- CI/CD pipelines: successful production deployment events feed deployment frequency and supply the deploy timestamp that closes out lead time.
- Incident management: incidents linked to a deployment feed change failure rate and recovery time.
Aggregate and calculate. Join deployment events to commits by SHA to compute lead time, count successful production deploys over a window for frequency, divide failed deploys by total deploys for change failure rate, and measure incident-open to incident-resolved for recovery time. Google's open-source Four Keys project does exactly this - it ingests webhooks from GitHub or GitLab and Cloud Build into BigQuery and computes the four metrics with SQL. Note that the repository was archived in January 2024 and is no longer maintained, so treat it as a reference implementation rather than a supported tool.
Visualize and feed back. Render the metrics on a dashboard, segment by team and service, and review trends in retros. The point is the feedback loop, not the dashboard.
Beyond Four Keys, several commercial tools compute DORA metrics from the same signals: LinearB, Sleuth, and Faros AI are widely used, and GitLab and GitHub ship built-in DORA dashboards.
When you wire up incident management as a signal source, make sure database-caused incidents are captured and linked to deployments - they land directly on change failure rate, deployment rework rate, and recovery time. As covered above, Pulse feeds this loop by detecting and root-causing database regressions automatically, which both shortens the recovery-time clock and keeps AI-accelerated change from quietly inflating your instability metrics.
Frequently Asked Questions
Q: What are the four key DORA metrics?
A: The four key DORA metrics are deployment frequency, lead time for changes, change failure rate, and failed deployment recovery time. They measure delivery throughput and stability, and are defined by the DevOps Research and Assessment program. DORA now formally tracks five metrics, having added deployment rework rate, and publishes them in its annual report - renamed in 2025 from the Accelerate State of DevOps Report to the State of AI-assisted Software Development report.
Q: Why was "time to restore service" renamed to "failed deployment recovery time"?
A: DORA renamed the metric in its 2023 report to scope it strictly to failures caused by a deployment, rather than any service disruption such as a data-center outage. The earlier names were "time to restore service" and, before that, MTTR (mean time to recovery). The 2024 report also reclassified it from a stability metric into a throughput metric.
Q: Is there a fifth DORA metric?
A: Yes - DORA now formally tracks five software delivery metrics. The fifth is deployment rework rate, on the instability side, which measures the share of deployments that are unplanned and triggered by a production incident. (Separately, and often confused with it, DORA added reliability in 2021 as an operational measure covering availability and latency of running software.) The original four remain the most commonly cited.
Q: What is a good change failure rate?
A: DORA does not publish exact per-tier change-failure-rate thresholds - it clusters respondents statistically, and the numbers shift each year. As a rough guide from secondary analyses of recent reports, elite performers sit around 5%, high and medium performers somewhere in the ~10-20% range, and low performers far higher. A rate at or below ~5% with frequent deployments is characteristic of the top cluster. Benchmark against the specific report year and treat any single threshold as approximate.
Q: How do you calculate lead time for changes?
A: Lead time for changes is the elapsed time from when a commit is merged to when that change runs in production. You compute it by joining the commit (by SHA) to the deployment event that shipped it and measuring the difference between the two timestamps, then taking the median across deployments. It measures pipeline efficiency, not coding time.
Q: What tools measure DORA metrics?
A: Google's open-source Four Keys project ingests source-control and CI/CD webhooks into BigQuery and computes the metrics, though the repository was archived in January 2024 and is now unmaintained - treat it as a reference implementation. Maintained commercial options include LinearB, Sleuth, and Faros AI, and both GitLab and GitHub offer built-in DORA dashboards. All derive the metrics from the same signals: PR or commit events, deployment events, and incident records.
Q: Does AI adoption hurt software delivery, according to DORA?
A: As of DORA's 2025 research, no - AI adoption correlated positively with software delivery throughput, reversing the more pessimistic 2024 read. But AI still correlated with lower stability: more change failures and rework. DORA frames AI as an amplifier of a team's existing practices, and its January 2026 ROI study reinforced that the returns depend on strong foundations (platform quality, small batches, fast rollback, strong testing) - without them, AI just ships instability faster.
Related Reading
- Database Monitoring Best Practices: metrics and signals that catch database regressions before they become production incidents.
- What Is Monitoring and Logging?: the observability foundation that feeds incident detection and recovery-time measurement.
- Log Management Best Practices: structuring logs so incidents are diagnosable and recovery time stays low.
- PostgreSQL Slow Queries: Diagnosis and Fixes: a common source of post-deployment regressions that drive change failure rate.
- MySQL Slow Query Log: instrumenting MySQL to surface slow-query regressions tied to a release.
- Diagnosing Slow Elasticsearch Queries: finding query regressions that degrade service after a deployment.