Query Analytics for Elasticsearch & OpenSearch
Transform how you approach query performance optimization. Detect, analyze and resolve slow queries with holistic insights and pattern detection, eliminating guesswork and providing actionable insights.
Three Powerful Capabilities
Pulse Query Analytics transforms how you approach query performance optimization with comprehensive insights that eliminate guesswork.

1. Query Pattern Recognition
- • Automatically groups similar queries into "families" for trend analysis
- • Identifies recurring performance bottlenecks across query types
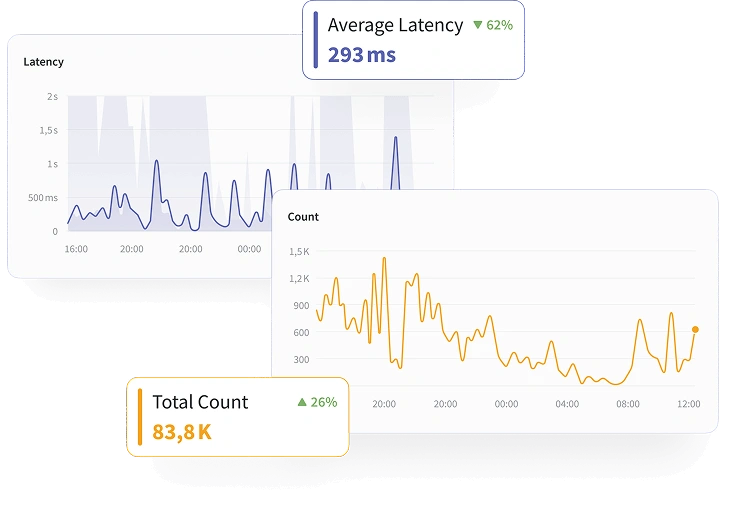
- • Correlates query patterns with latency spikes and resource consumption

2. Comprehensive Query Statistics & Breakdowns
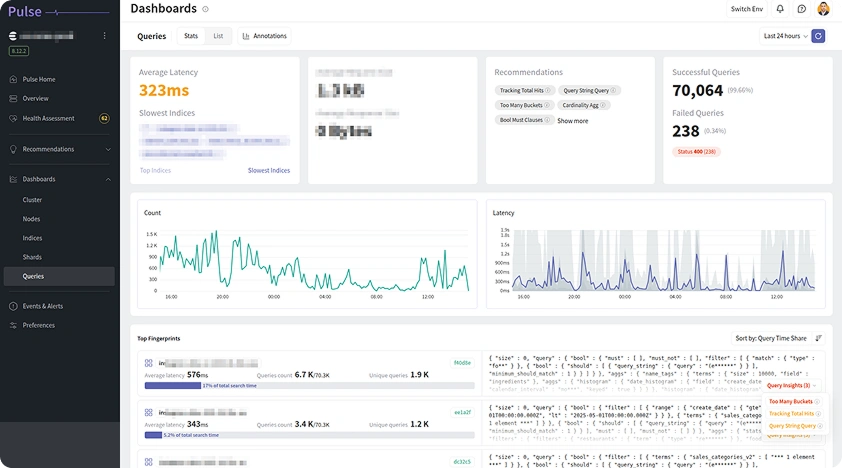
- • Detailed analytics on execution time, CPU usage, and data throughput
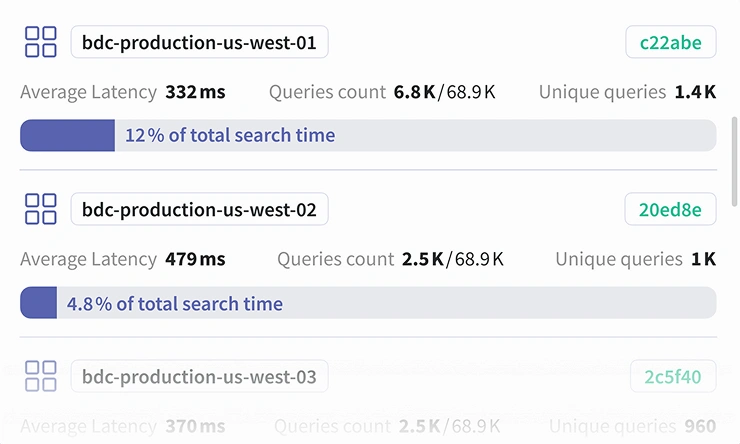
- • Performance breakdowns by indices, users, and custom parameters
- • Clear identification of your slowest indices and optimization opportunities

3. Holistic Cluster Correlation
- • Connects query performance with broader system events
- • Reveals whether issues stem from cache misuse, cluster sizing, or query inefficiency
- • Provides complete root cause analysis beyond individual query traces
Optimizing Search and Analytics For Leading Brands

Stop Playing Guessing Games with Query Performance
Here's what typically happens when search gets slow:
- • You check individual queries one by one (exhausting)
- • You analyze logs that don't connect the dots (time-consuming)
- • You make educated guesses about root causes (risky)
Meanwhile, performance issues impact customer experience and revenue.
Sound familiar?
Real Impact for Platform Engineers
With Pulse you'll move from reactive firefighting to proactive optimization:
- ✅ Detect performance issues before they escalate
- ✅ Analyze query families to understand true patterns
- ✅ Resolve root causes with confidence, not guesswork
No more endless dashboard staring. No more scattered log analysis. Just clear, actionable insights that help you optimize your clusters with confidence.
How it works?
-
 Broadcast query logs automatically to Pulse via our proprietary smart integration.
 -
Alternatively, install Pulse's Query-Analytics proxy alongside your client or application.
-
Our integration intercepts all search requests, and forwards them safely to Pulse.
-
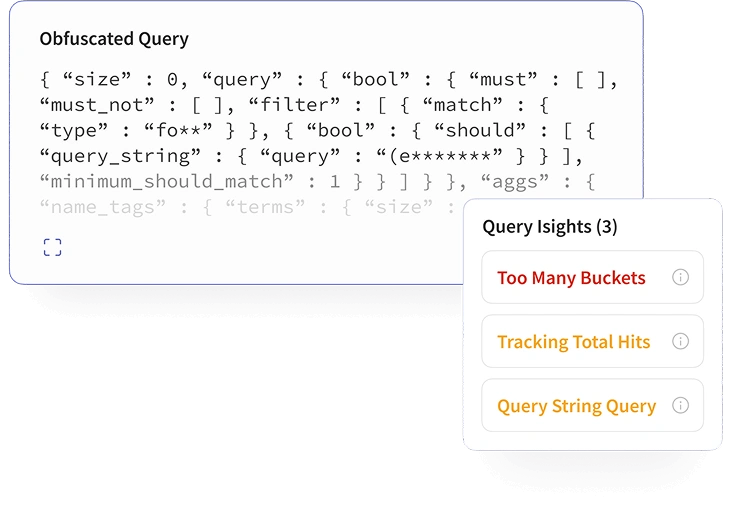
Pulse automatically obfuscates queries and correlates them to system metrics and events.
-
Use the UI to browse, filter, visualize, and optimize your queries in minutes.