Supercharge Your
Elasticsearch & OpenSearch
Optimization tools, completely free. Trusted by SREs, DevOps, and Platform Engineers worldwide.
Get Started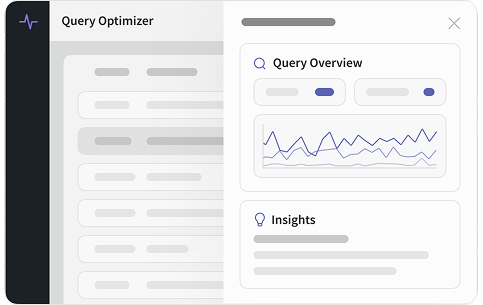
OpenSearch & Elasticsearch Query Optimizer
Investigate slow queries and optimize search performance in minutes
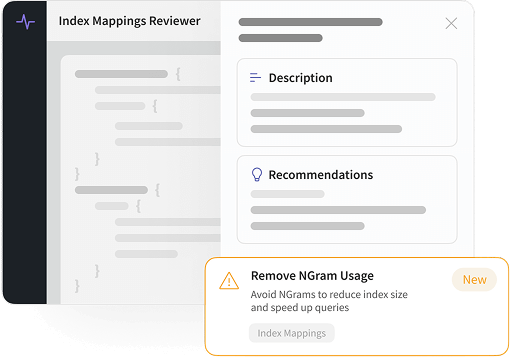
Index Mappings Reviewer
Transform your index performance with intelligent mapping analysis
VS Code Extensions
Supercharge your development workflow with our professional VS Code extensions. Bring Kibana DevTools-like functionality directly into your editor with advanced query optimization, mapping validation, and mock data generation.
Elasticsearch DevTools
For Elasticsearch & Elastic Cloud
Kibana DevTools-like interface, advanced query editor with IntelliSense, comprehensive mapping validation, and mock data generation — directly in VS Code.
 Kibana DevTools-like interface
- Advanced query editor with IntelliSense
- 80+ snippets & keyboard shortcuts
- Mock data generation
OpenSearch DevTools
For OpenSearch & Amazon OpenSearch Service
A VS Code extension designed for OpenSearch developers. Run and debug queries, optimize mappings, and generate sample data — all without leaving your editor.
- Query execution with Kibana-style DevTools panel
- IntelliSense for OpenSearch queries & aggregations
- 50+ snippets & quick actions for faster editing
- Test data generator and mapping validator
Why Engineering Teams Choose Pulse
Save Hours Daily
Automated analysis that would take hours manually, delivered in minutes

Expert Insights
Professional-grade recommendations from battle-tested optimization strategies

Reduce Costs
Optimize resource usage and improve performance without scaling hardware

Prevent Issues
Proactive monitoring that catches problems before they affect users