Elasticsearch Monitoring
Elasticsearch powers some of the most data-intensive systems in the world - but even the strongest search engine can fail without proper visibility and control. Whether you're running the full ELK Stack (Elasticsearch, Logstash, Kibana), Elastic Cloud, or a self-managed deployment, Pulse delivers intelligent, real-time Elasticsearch monitoring designed to keep your clusters healthy, optimized, and predictable.
Get a complete view of every node, index, and shard, plus actionable insights powered by AI and backed by human experts. From Elastic Cloud deployments to on-premise Elastic Stack environments, Pulse helps you monitor Elasticsearch with precision and confidence - going beyond what Kibana monitoring alone can offer.
Optimizing Search and Analytics For Leading Brands

Complete Visibility Into Elasticsearch Performance
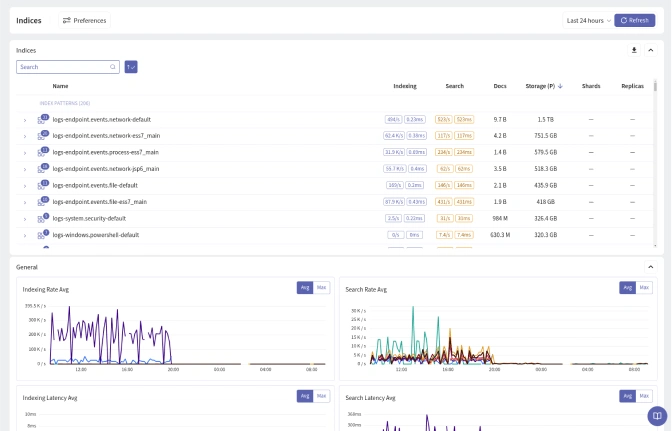
Running Elasticsearch at scale means tracking hundreds of metrics - CPU usage, JVM memory, shard distribution, index growth, and more. Pulse makes it effortless to monitor Elasticsearch across your entire infrastructure through unified dashboards and deep-dive analytics.
-

Full-Stack Observability:
Our platform aggregates metrics from every layer - cluster health, query performance, and system utilization - giving you a single pane of glass for your entire Elasticsearch environment, whether you're using the ELK Stack, Elastic Cloud, or a custom deployment.
-
Detect Issues Early:
Instead of waiting for slow searches or timeouts, Pulse surfaces anomalies before they become incidents. You’ll see performance shifts, data imbalance, and resource bottlenecks as they happen, not after the fact.
-
Monitor From Anywhere:
Monitor Elasticsearch whether you’re running on Elastic Cloud, AWS, Azure, or on-premise. Pulse works alongside your existing ELK Stack and Kibana setup, adapts to any deployment model, and supports hybrid architectures for enterprise reliability.
Proactive Elasticsearch Metrics Monitoring
Pulse goes beyond standard dashboards. It transforms Elasticsearch metrics into meaningful insights that improve stability, performance, and cost efficiency.
-
Smarter Metric Collection:
Our elasticsearch metrics monitoring system automatically prioritizes the most critical indicators - heap pressure, node failures, indexing latency, and query throughput - so you focus on what matters most.
-
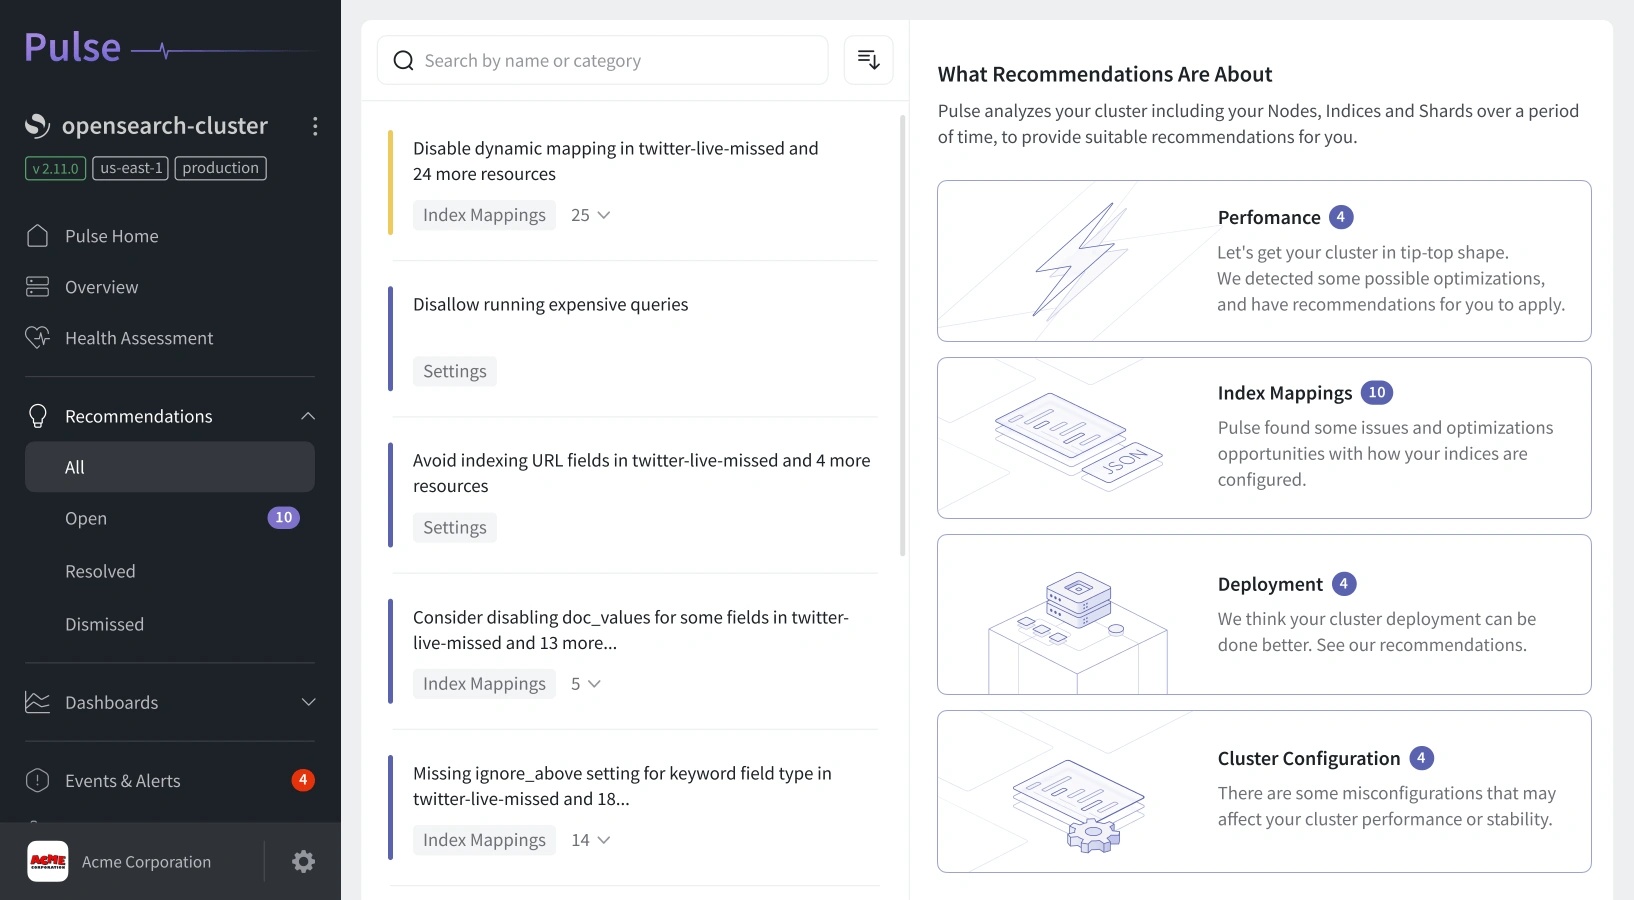
Data-Driven Optimization:
By combining time-series data with historical analysis, Pulse identifies recurring performance issues and provides practical recommendations for improvement.
-
AI-Assisted Insights:
Machine learning models detect unusual patterns across your cluster, alerting you to emerging risks and potential configuration issues long before users notice them.
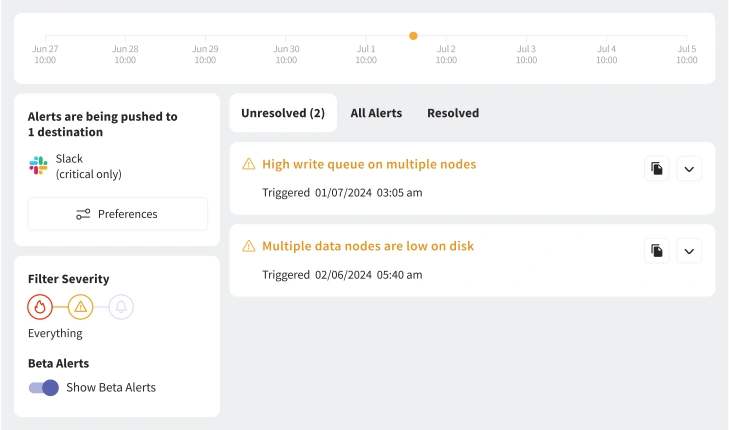
Smart Alerts and Predictive Anomaly Detection
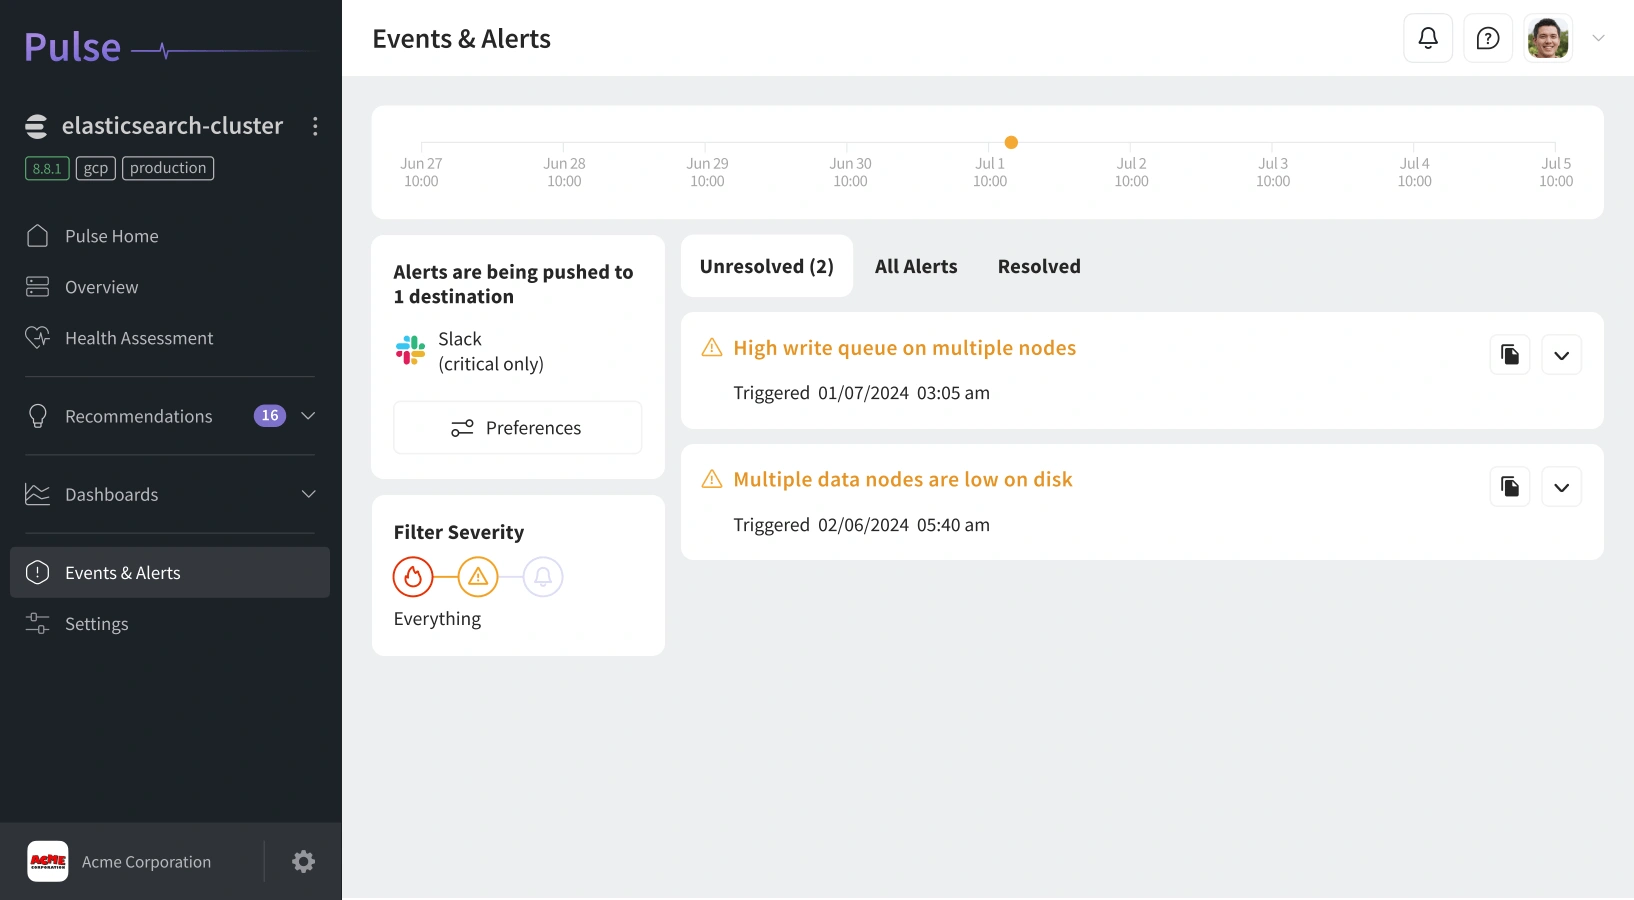
Traditional alerting floods your inbox with noise. Pulse delivers targeted, intelligent alerts that help you act faster and smarter.
-
Contextual Notifications:
Each alert includes relevant cluster data, metrics, and potential causes - allowing you to resolve problems efficiently without sifting through endless logs.
-
Predictive Detection:
Our AI models learn from your environment over time. They can forecast likely performance drops and highlight vulnerabilities that need preventive action.
-
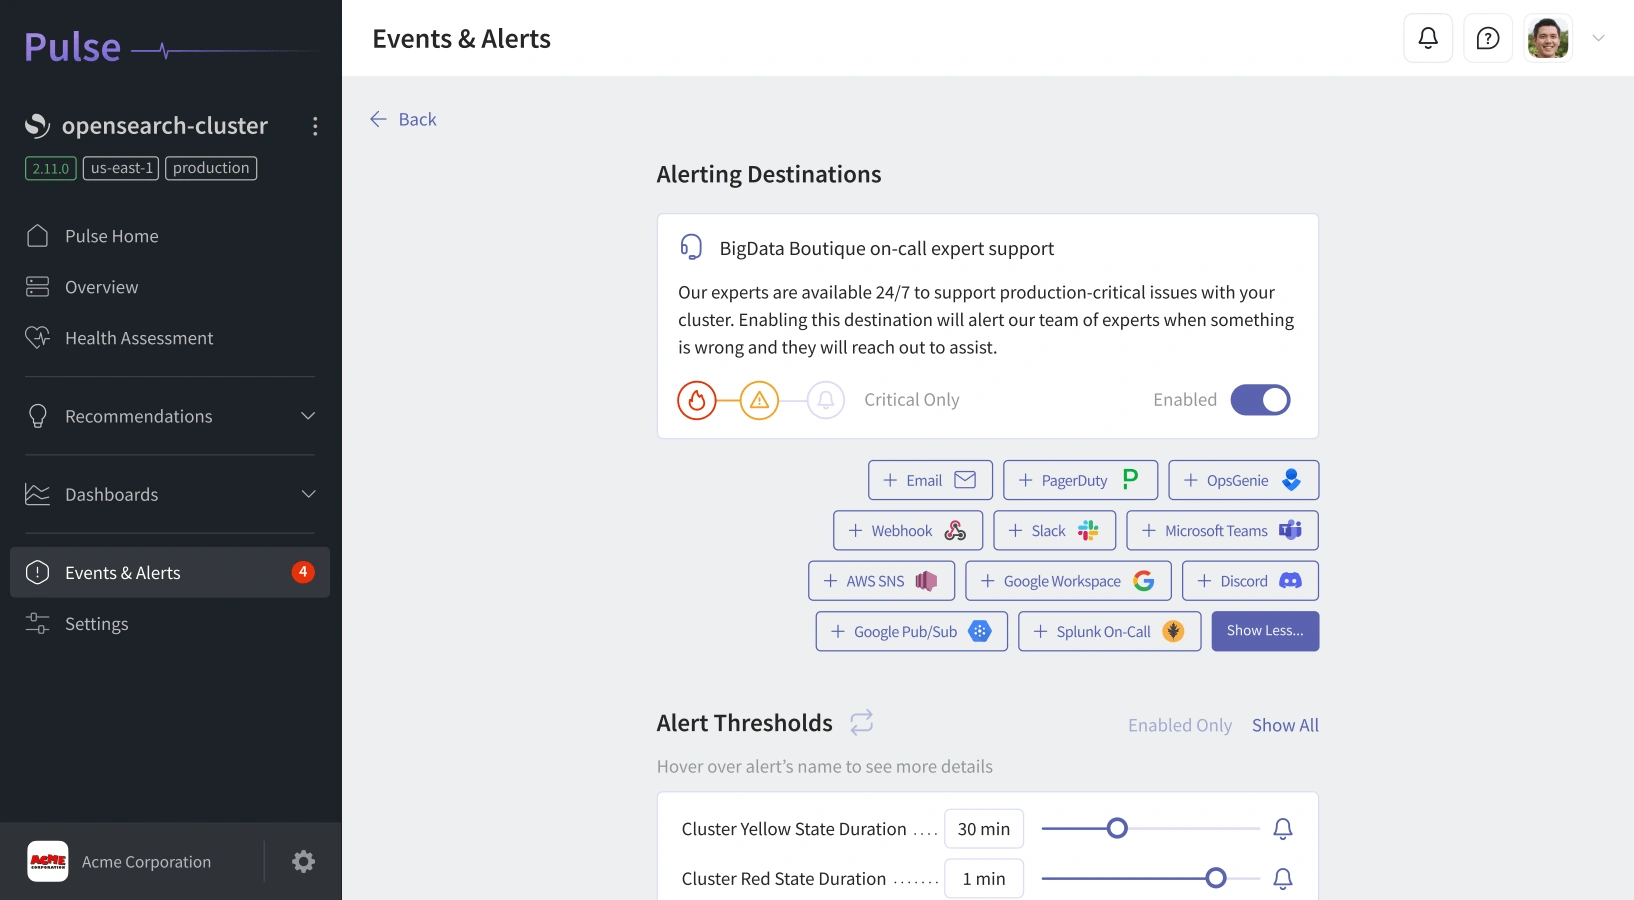
Integrated Communication:
Receive alerts directly in Slack, Teams, Datadog, PagerDuty, or Discord. Pulse connects seamlessly to your workflows, ensuring the right people see the right alerts at the right time.
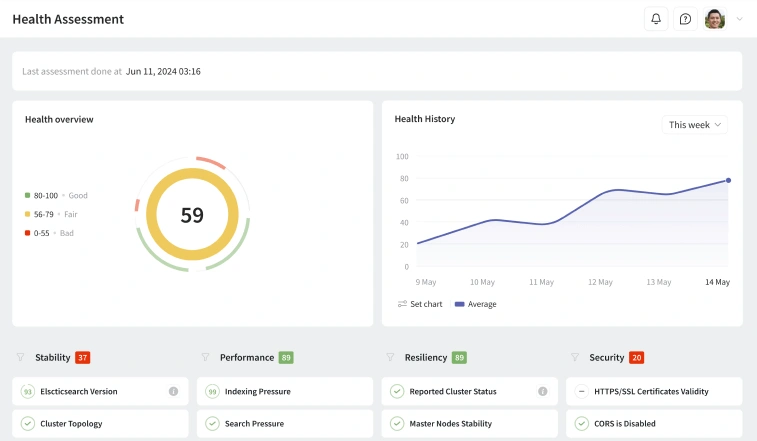
Actionable Dashboards for Elasticsearch
Visualization alone isn’t enough - you need dashboards that lead to decisions. Pulse dashboards are built by Elasticsearch experts for real-world operations, providing both visibility and control.
-
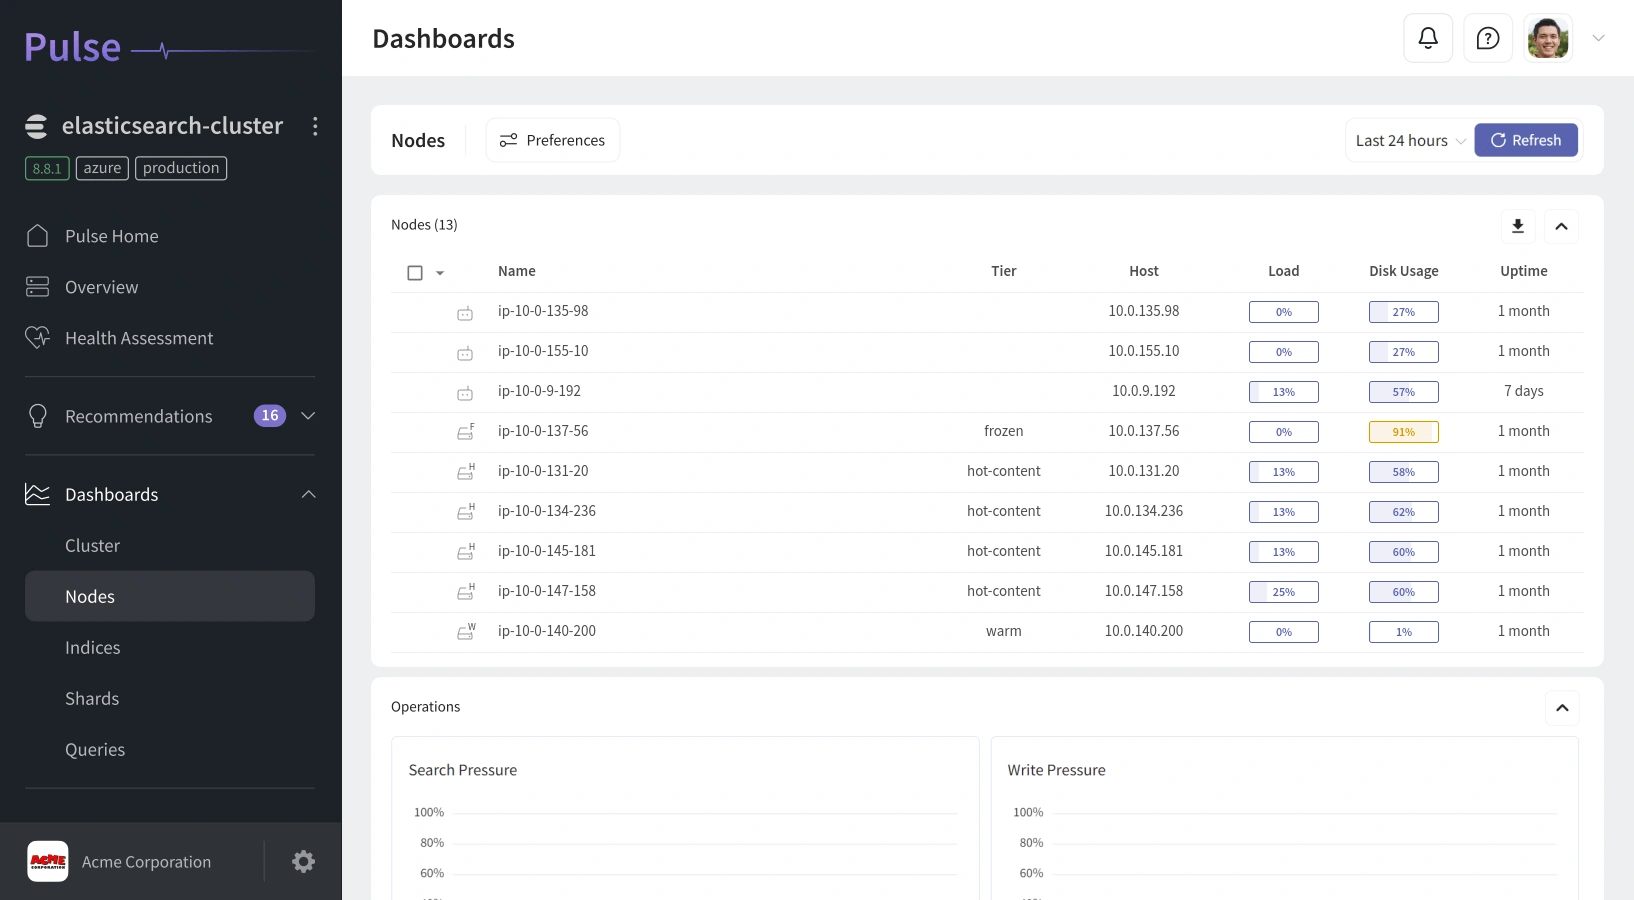
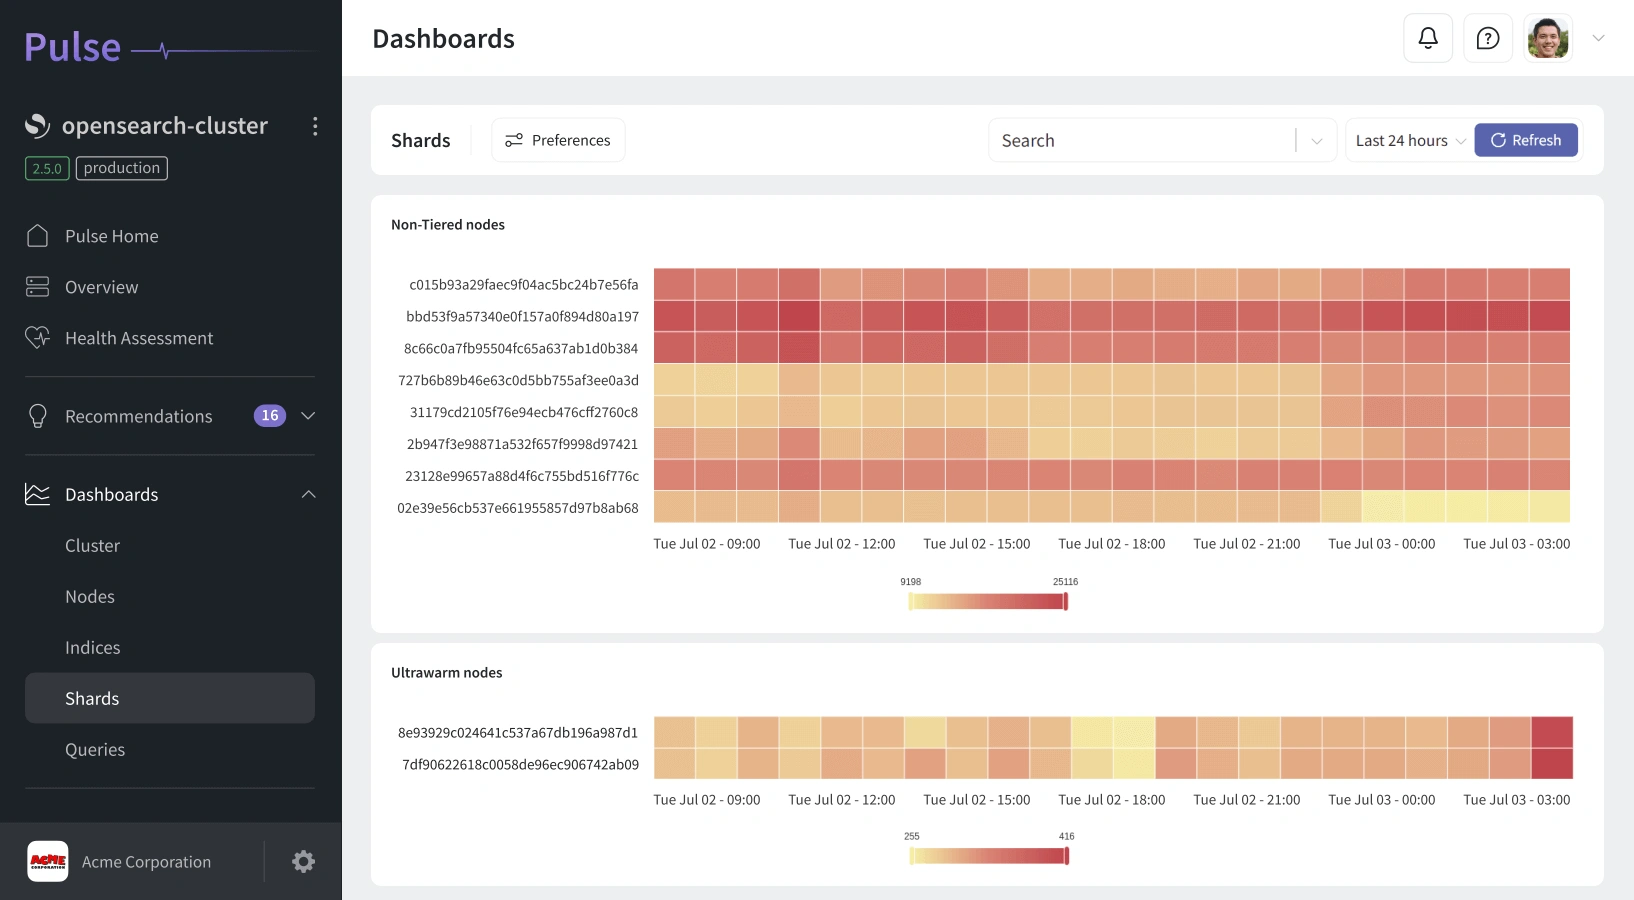
Designed for Action:
Go beyond simple graphs. Drill into specific shards, analyze query latency, and understand node behavior in real time with intuitive, interactive dashboards.
-
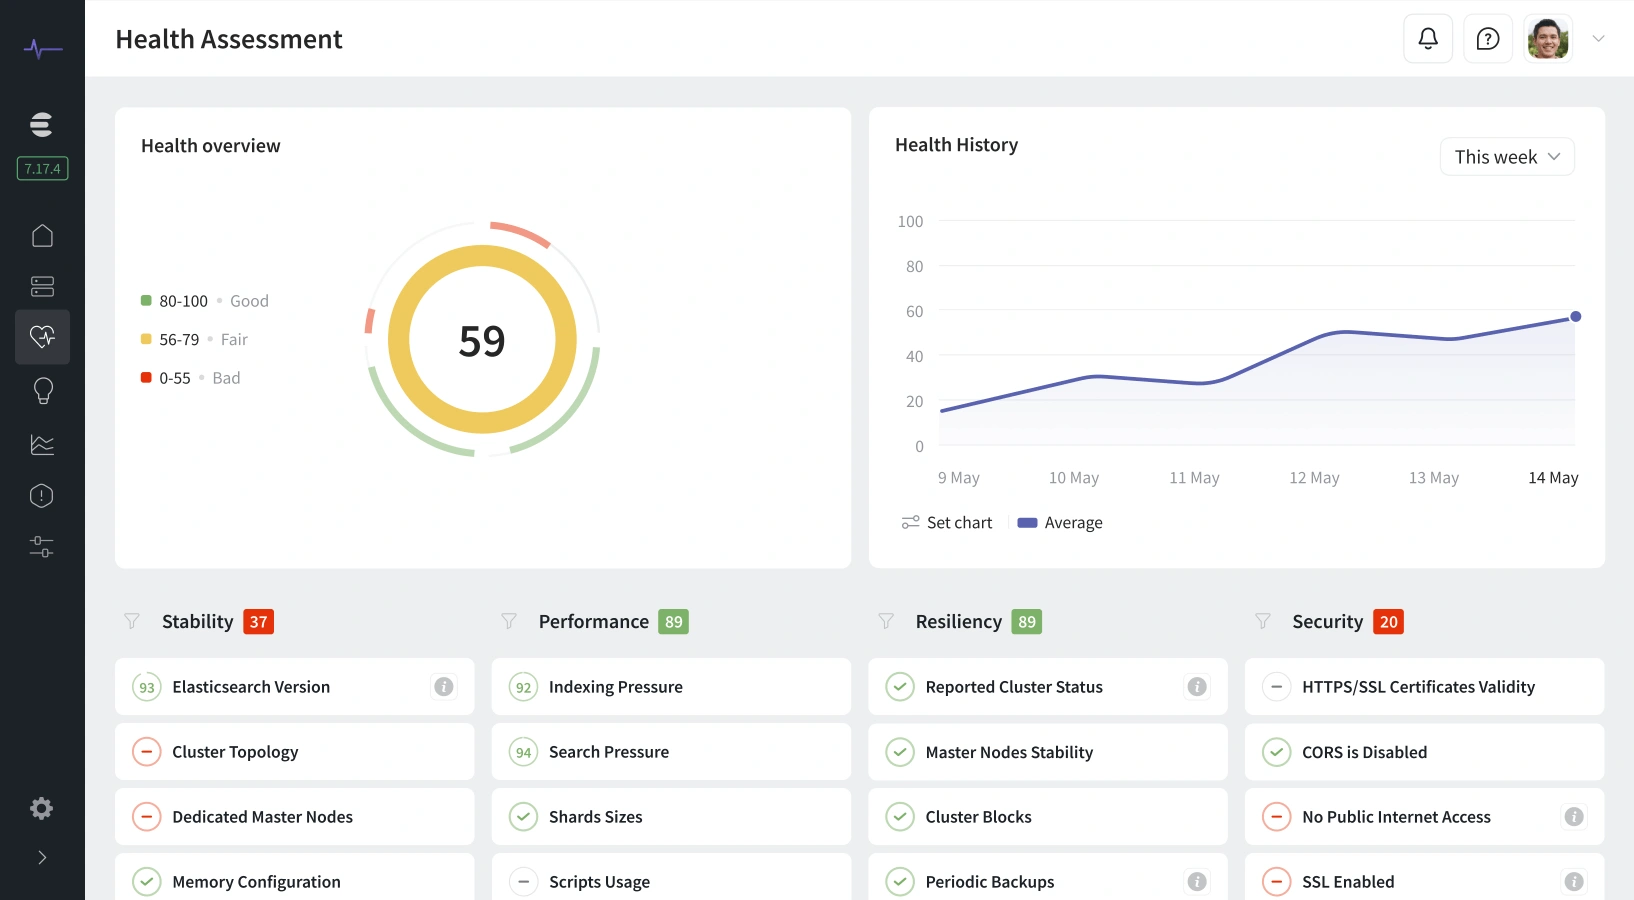
Performance at a Glance:
View cluster health, unassigned shards, heap usage, and thread pool activity in a single, configurable interface. Pulse shows exactly what impacts performance and how to fix it.
-
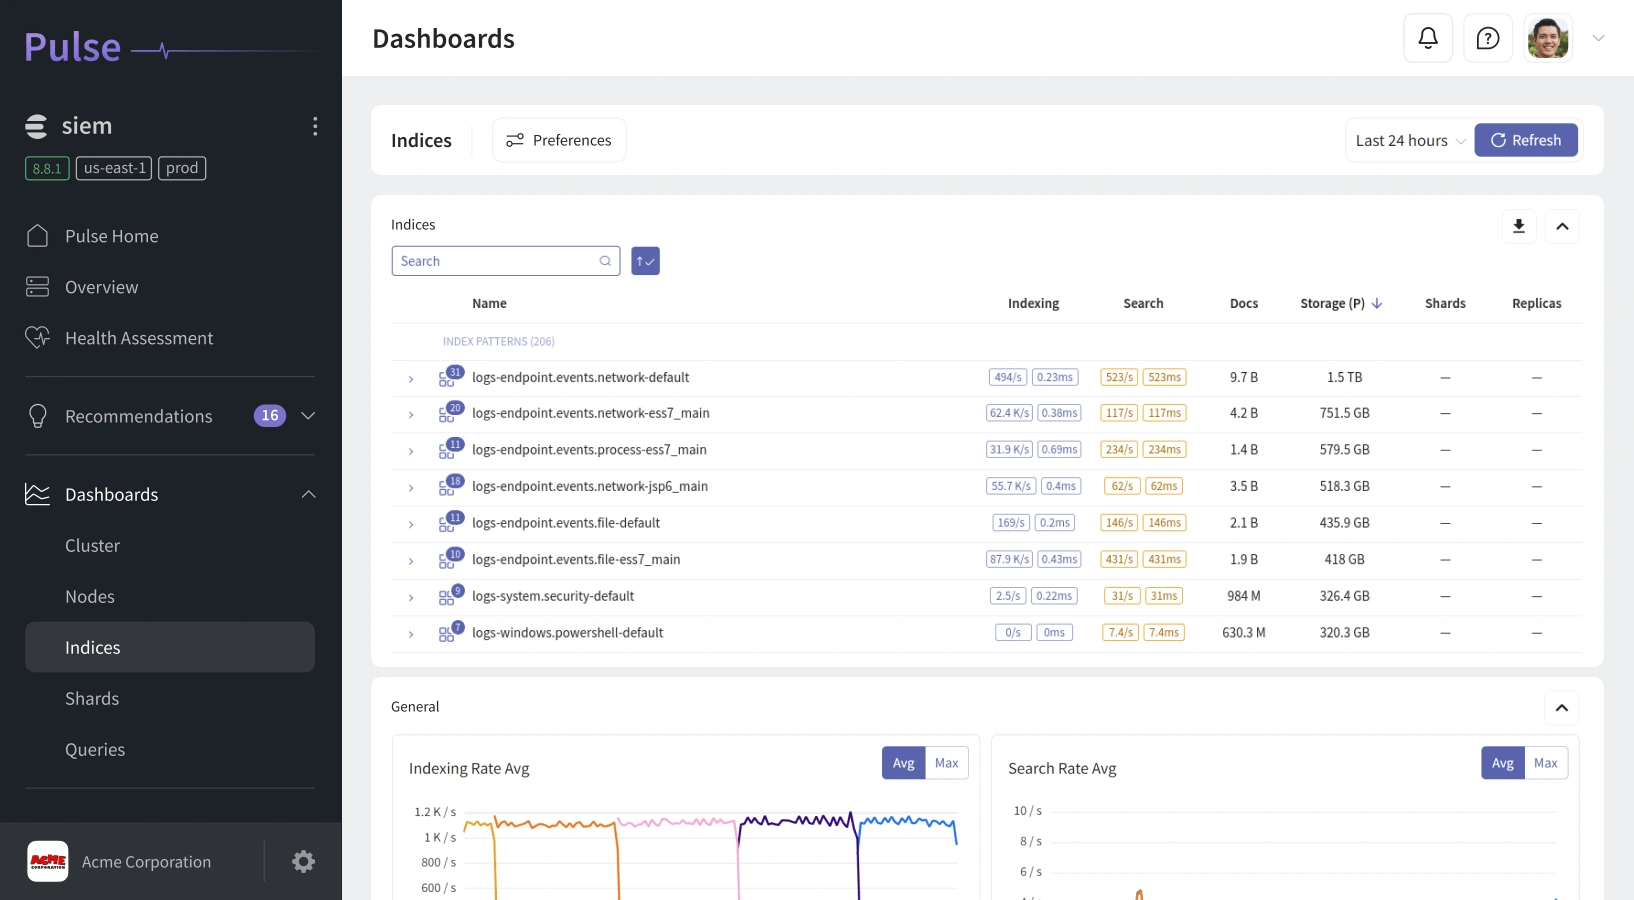
Enterprise-Ready Analytics:
Our dashboards scale with your data - supporting multi-cluster visibility, anomaly overlays, and historical performance comparisons across months of data.
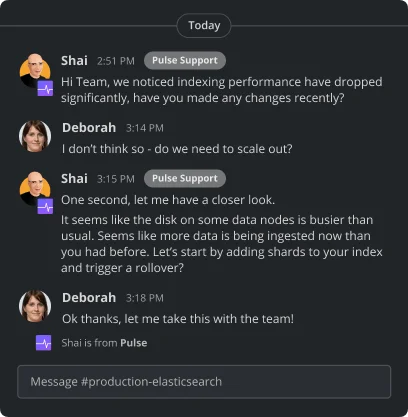
Why Pulse Is the Future of Elasticsearch Monitoring
Most monitoring tools stop at metrics. Pulse combines automation, machine intelligence, and human expertise to deliver truly proactive support.
-
AI + Human Expertise:
Automation handles detection, but humans deliver understanding. Our engineers interpret anomalies, recommend improvements, and provide hands-on help when it matters most.
-
24/7 Reliability:
Your search infrastructure never sleeps - and neither do we. Pulse provides continuous Elasticsearch monitoring with round-the-clock coverage and guaranteed SLA response times.
-
Proven at Scale:
Built from over a decade of experience managing enterprise search clusters, Pulse is trusted by organizations worldwide to keep Elasticsearch environments fast, stable, and efficient.
Speak to Our Elasticsearch Monitoring Specialists
Ready to take control of your Elastic Stack? Whether you're using Kibana, ELK, or Elastic Cloud, our specialists help you configure monitoring tools, identify what's important to monitor, and optimize every Elasticsearch node, index, and shard.
Speak with us today to learn more about Elasticsearch and how Pulse helps you monitor in Elasticsearch with clarity and confidence.
FAQ
What is Elasticsearch monitoring and why is it important?
Elasticsearch monitoring is the continuous tracking of cluster health, performance, and stability. It helps detect anomalies early, prevent downtime, and maintain fast, reliable search results.
How does Pulse improve Elasticsearch monitoring?
Pulse combines AI-powered insights with expert oversight, giving you a complete view of your cluster and actionable recommendations to maintain optimal performance.
What metrics does Pulse monitor in Elasticsearch?
We track critical metrics including heap usage, shard distribution, query latency, CPU load, and index growth - providing visibility across all Elasticsearch components.
Does Pulse support self-managed and Elastic Cloud environments?
Yes. Pulse supports self-hosted deployments, Elastic Cloud, and full ELK Stack environments. It works alongside Kibana and complements your existing monitoring setup across hybrid and multi-cloud infrastructures.
Can Pulse help reduce the cost of running Elasticsearch?
Absolutely. By identifying inefficient queries, misconfigured shards, and unbalanced resources, Pulse helps lower infrastructure costs while improving speed and stability.