Transform Complex Profile Output Into Clear Insights
No more parsing through nested JSON structures—see exactly where your queries are spending time and identify optimization opportunities at a glance.
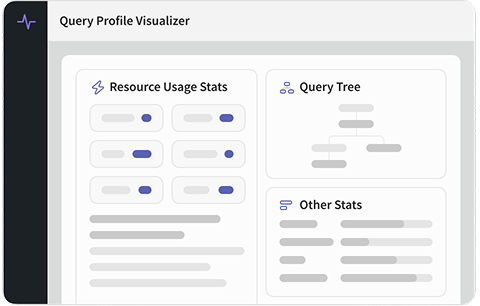
📊 Interactive Query Breakdown
Visual representation of query execution
Transform Elasticsearch and OpenSearch query profile output into intuitive, interactive visualizations. Our visualizer provides a clear breakdown of query execution phases and timing, making it easy to understand how your query is actually executed.
-
 Visual Timeline: See query execution phases laid out in an intuitive visual timeline with time breakdowns.
 -
Interactive Exploration: Click and expand different sections to dive deep into specific query components.
-
Color-Coded Performance: Instantly identify slow operations with color-coded performance indicators.
-
Shard-by-Shard Analysis: View performance across all shards to identify skewed execution.
🔍 Bottleneck Identification
Instantly spot time-consuming operations
Our intelligent analysis automatically identifies and highlights the most time-consuming operations in your query. No need to manually scan through JSON—the bottlenecks are made obvious through visual cues and sorting.
-
Automatic Hotspot Detection: Automatically identifies and highlights operations consuming the most time.
-
Percentage Breakdown: See what percentage of total time each operation consumes.
-
Performance Rankings: Operations sorted by time consumption for easy prioritization.
-
Comparison Views: Compare performance across different query components side by side.
🔬 Drill-Down Capabilities
Explore query components in detail
Dive deep into any part of your query execution to understand performance characteristics. Our drill-down interface lets you explore nested query components, aggregations, and filters with ease.
-
Nested Component Analysis: Explore nested bool queries, aggregations, and filters at any depth.
-
Execution Context: See the full context of where each component fits in the overall query.
-
Time Attribution: Understand how time is attributed to parent and child components.
-
Filter vs Query Analysis: Clearly distinguish between filter context and query context execution.
💡 Optimization Insights
Visual cues for improvement opportunities
Beyond just visualization, our tool provides actionable insights through visual cues that highlight areas for potential improvement. Learn not just what's slow, but what you can do about it.
-
Smart Suggestions: Contextual optimization suggestions based on your actual query profile data.
-
Anti-Pattern Detection: Highlights common query anti-patterns visible in the profile output.
-
Cost Analysis: Understand the performance cost of different query constructs and features.
-
Best Practice Tips: Learn optimization techniques applicable to your specific query patterns.
Why Use Our Query Profile Visualizer
Save Debug Time
Instantly understand query performance instead of parsing JSON for hours

Clear Visualization
Intuitive visual representation that makes complex queries easy to understand

Zero Setup
Paste your profile output and start analyzing—no installation required

Interactive Exploration
Click and explore different parts of your query execution interactively
Actionable Insights
Get optimization suggestions based on actual profile data
Universal Support
Works with both Elasticsearch and OpenSearch profile output
How to Use
Get started in three simple steps
Run Profiled Query
Execute your query with the profile: true parameter in
Elasticsearch or OpenSearch.
Paste Profile Output
Copy the profile section from your query response and paste it into our visualizer.
Explore & Optimize
Interact with the visualization to understand bottlenecks and get optimization suggestions.