Database monitoring is the continuous observation of a database's performance, health, and availability, usually by collecting metrics, logs, and events and turning them into something a person or a system can act on. The database is where most applications keep the state they cannot afford to lose, so when it slows down or stops responding, everything in front of it degrades with it. A web request that normally returns in 50 milliseconds starts taking two seconds; a checkout flow times out; a background job backs up until the queue overflows. Monitoring exists to catch that drift early, ideally before a user files a ticket.
The word covers more ground than people expect. It is not only "is the database up?" - that question is the easy part. The harder and more valuable part is understanding how the database is behaving under real load: which queries are eating the CPU, whether the cache is doing its job, how far a replica has fallen behind, and whether disk space will run out next Tuesday. Good monitoring answers those questions on an ongoing basis rather than during a 2 a.m. incident.
What You Actually Monitor
Database telemetry falls into a handful of categories, and a serious setup covers all of them rather than fixating on one.
Performance metrics describe how the engine handles work. Query latency tells you how long statements take, and watching the tail (p95, p99) matters more than the average because a few slow queries can wreck a user experience that looks fine on paper. Throughput, often expressed as transactions per second, shows how much work the database is doing. Connection counts reveal whether you are approaching the pool or server limit, a common cause of sudden, total outages. The cache hit ratio - the share of reads served from memory instead of disk - is a strong early signal of trouble; when it drops, the engine is going to disk more often and latency climbs with it. Replication lag measures how far behind your replicas are, which matters for both read consistency and failover readiness. Locks and deadlocks tell you when transactions are contending for the same rows and serializing work that should run in parallel.
Resource and infrastructure metrics describe the machine underneath. CPU utilization, memory pressure, disk I/O throughput and latency, and free disk space all bound what the database can do. A database does not exist in a vacuum, and many "database problems" are really an exhausted IOPS budget or a volume that filled up because WAL or binary logs were not being recycled.
Availability and uptime is the baseline contract: is the database reachable and accepting connections, and how quickly do you detect when it is not. Security and audit events cover failed authentication attempts, privilege changes, and access to sensitive tables - signals you need for both intrusion detection and compliance regimes like SOC 2, HIPAA, or PCI DSS. Backup health is the category teams most often skip and most regret skipping: a backup job that has been silently failing for three weeks is indistinguishable from having no backups at all, right up until you need to restore.
For concrete queries and thresholds across PostgreSQL and MySQL - the exact SQL to pull cache hit ratios, replication lag, blocking chains, and growth rates - see our database monitoring best practices guide. This post stays at the conceptual level; that one is the practical reference.
Reactive vs. Proactive Monitoring
There is a real difference between watching a database and understanding it, and it maps cleanly onto two postures.
Reactive monitoring waits for something to break and then helps you figure out what happened. A dashboard shows red, an alert fires because CPU crossed 90%, and an engineer starts digging. This is better than nothing, but the failure has already reached production by the time anyone looks. You are paying for the incident in user-facing latency, missed SLAs, and the engineer's evening. Worse, a raw alert like "CPU is high" rarely tells you why - high CPU is a symptom of a missing index, a bad query plan, a runaway autovacuum, or a connection storm, and sorting between those candidates by hand takes time you do not have during an outage.
Proactive monitoring tries to catch the cause while it is still small. Instead of alerting on a threshold breach, it watches for the leading indicators: a query whose plan just changed and started doing a sequential scan, a steadily falling cache hit ratio, dead-tuple accumulation that will eventually trigger painful vacuums, a disk-growth trend that will hit the ceiling in days. The goal is to act during business hours on a warning rather than at midnight on an outage. Proactive monitoring is also where monitoring stops being a passive dashboard and starts feeding the rest of your operational work.
Alerting, Optimization, and Capacity Planning
Monitoring is only useful if it changes what you do, and three workflows turn collected metrics into action.
Alerting is the bridge between data and response, and it is easy to get wrong in the obvious direction: too many alerts and people learn to ignore them. Effective alerting is tiered - page someone for "database unreachable" or "disk under 5%," but only send a low-urgency notification for "table bloat over 30%." Thresholds should come from your own baselines, not generic defaults, because a 200ms query might be perfectly normal for one workload and a regression in another.
Query optimization is where monitoring pays for itself most directly. Slow-query data and execution-plan history point straight at the statements worth fixing - the missing index, the query that started scanning a whole table after a data shift, the N+1 pattern hammering the connection pool. Without that telemetry you are guessing; with it you can rank fixes by actual impact. Capacity planning is the long-horizon counterpart. Trends in storage growth, connection counts, and resource utilization let you forecast when you will need a bigger instance or another replica, so scaling becomes a planned change rather than an emergency at 95% disk.
Where Pulse Fits
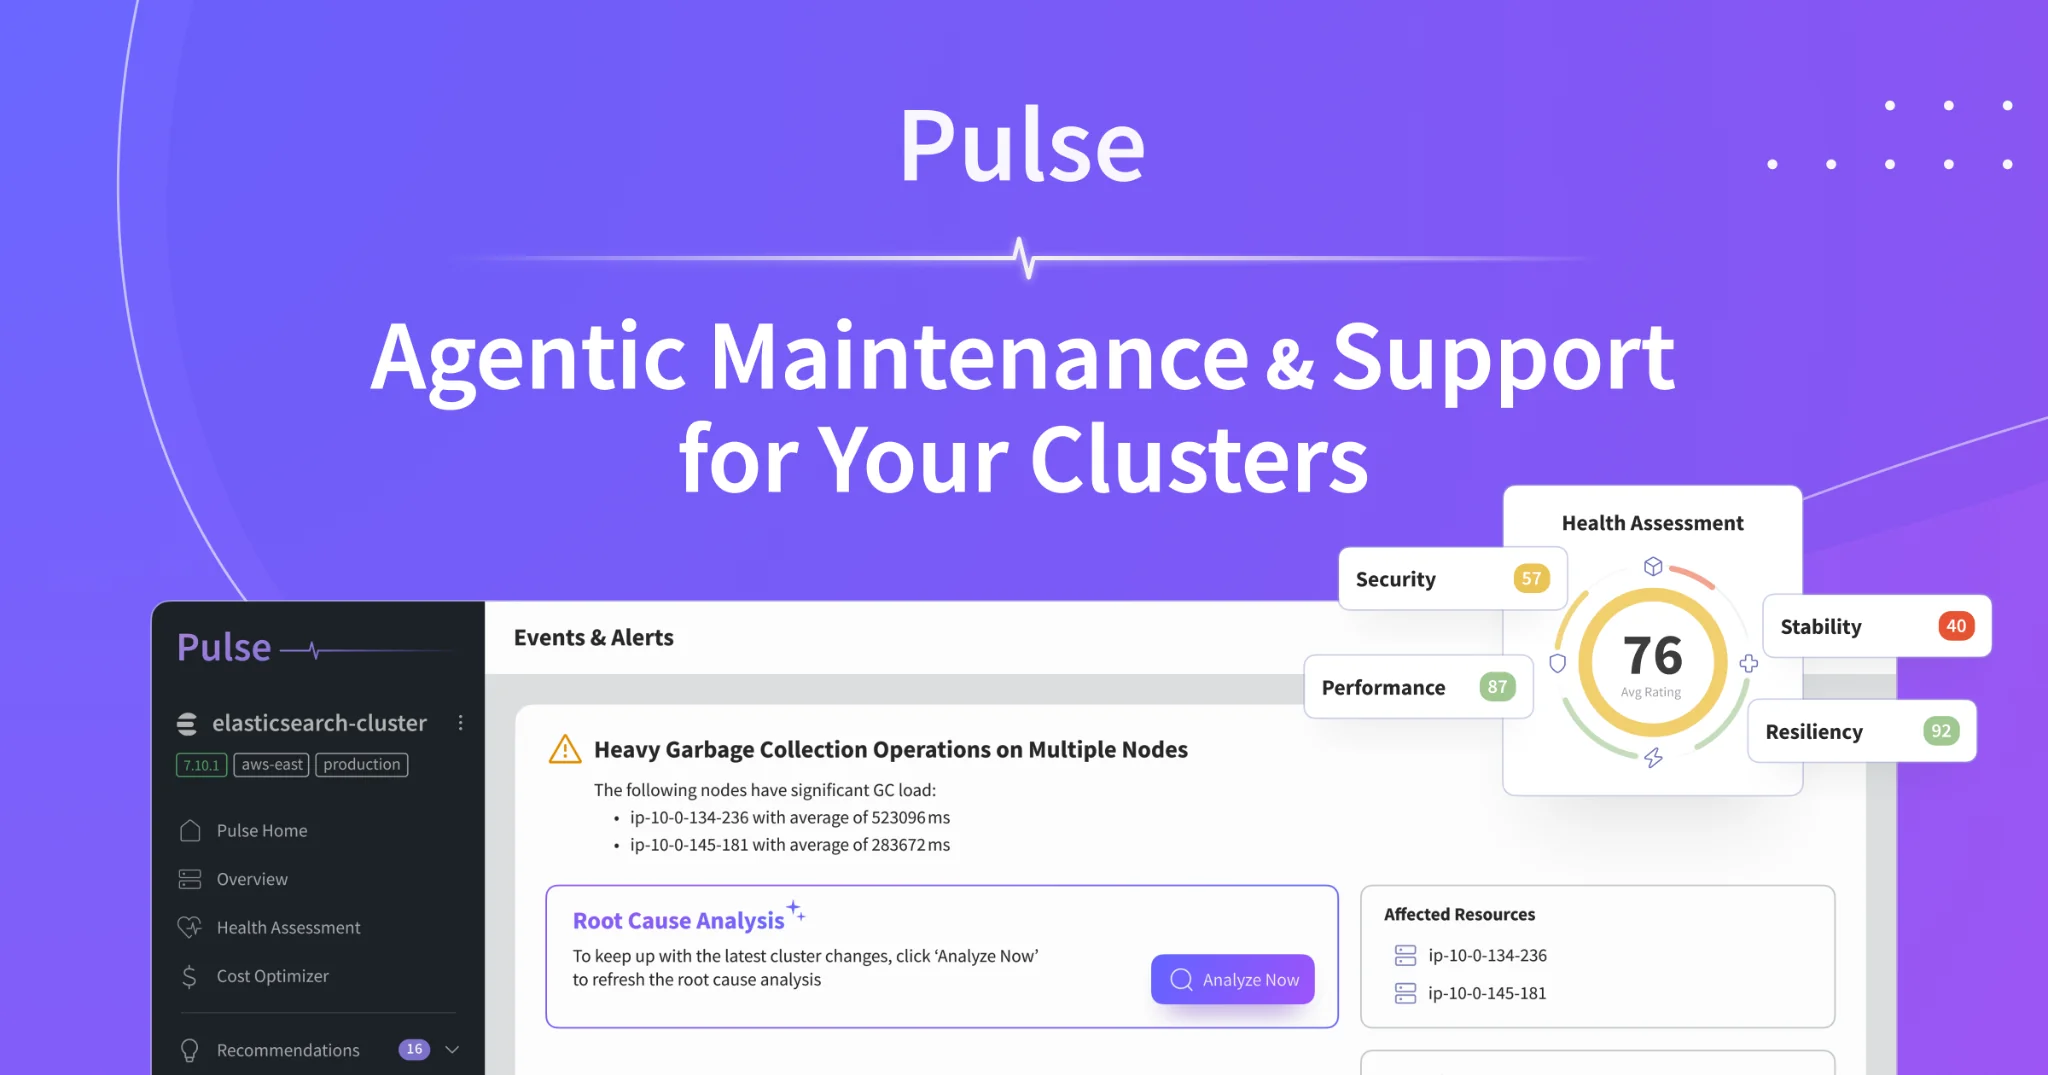
Most monitoring tools stop at showing you the data. They will draw you a beautiful graph of rising CPU and leave the diagnosis to you. That gap - between a symptom on a dashboard and the actual root cause - is where on-call time disappears, and it is the gap Pulse is built to close.
Pulse is a proactive, agentic monitoring platform for databases and the data infrastructure around them. It continuously watches PostgreSQL alongside search and streaming engines like Elasticsearch, OpenSearch, and ClickHouse, and instead of just flagging that something is wrong, it performs automated root-cause analysis. When latency climbs, Pulse correlates the query plans, lock contention, resource pressure, and recent changes that an engineer would otherwise piece together by hand, and it points at the cause - a plan regression, a missing index, a connection-pool exhaustion - rather than the symptom. In many cases it suggests the concrete fix, and for a class of issues it can apply the remediation itself.
The proactive part matters as much as the analysis. Pulse looks for the leading indicators described above and surfaces them before they turn into incidents, which is the difference between adjusting a configuration during the workday and restoring service at night. Connecting a database to Pulse turns monitoring from a wall of graphs you have to interpret into a system that interprets them for you - which is the whole point of monitoring in the first place.
The Short Version
You need database monitoring because the database is the part of your stack you can least afford to have fail quietly, and because the difference between catching a regression as a warning and catching it as an outage is almost entirely a function of whether you were watching the right signals. Cover the full picture - performance, resources, availability, security, and backups - lean toward proactive detection over reactive firefighting, and wire the data into alerting, optimization, and capacity planning so it actually changes decisions. Do that, and the database stops being the thing that surprises you.