"Observability" and "monitoring" get used interchangeably, and that costs teams real debugging time. They are not the same thing. Monitoring tells you that something is wrong. Observability helps you work out why. One watches a fixed set of signals you decided to care about in advance; the other gives you the raw material to investigate questions you never thought to ask. A mature system needs both, and the line between them matters most when you are staring at a production database that is slow for reasons no dashboard predicted.
What Monitoring Actually Does
Monitoring is the practice of collecting predefined signals and checking them against thresholds. You decide ahead of time which metrics matter, what "normal" looks like, and what should fire an alert. CPU above 85 percent for five minutes, error rate over one percent, replication lag past 30 seconds - these are the known-unknowns. You know the failure modes you are watching for, and monitoring tells you when one of them happens.
The tooling reflects this. Dashboards plot time series. Alerting rules evaluate expressions on a schedule. APM products trace request latency against service-level objectives. All of it depends on someone having anticipated the question in advance and wired up a chart or an alarm to answer it.
For databases, the known signals are well understood. Active connections against max_connections. Deadlock count. Cache hit ratio. Buffer pool usage. Checkpoint frequency. Replication lag. These are bounded, low-cardinality metrics, and they are genuinely useful. When connections climb toward the ceiling, you want to know before the application starts refusing work. Monitoring is good at exactly this: catching the failure modes you already understand, fast.
Where Monitoring Runs Out
The limit shows up the moment something breaks in a way you did not anticipate. A dashboard shows CPU spiking on the primary. That single fact is consistent with a dozen causes: a missing index, a plan regression after a statistics refresh, a flood of edge-case queries, an autovacuum running against a large table, a deployment that shipped an hour ago and only now hit a hot path. The chart shows the symptom. It cannot tell you which story is true.
Aggregation makes this worse. To keep dashboards readable you average across hosts, regions, and query shapes. That averaging hides the subset that actually matters. Mean query latency can look flat while one tenant on one shard degrades badly, because their traffic is a rounding error in the global number. You can build another dashboard sliced differently, but you can only slice along dimensions you predicted. The query you need at 2 a.m. is usually the one nobody built a panel for.
This is the gap. Monitoring answers the questions you encoded ahead of time. Novel failures, by definition, are not on that list.
What Observability Adds
Observability is the property of a system that lets you ask arbitrary new questions about its behavior from the data it already emits, without shipping new code to capture them. The test is practical: when a fresh, never-seen failure appears, can you explore your way to the cause using existing telemetry? If yes, the system is observable. If you have to add instrumentation and redeploy first, it was not.
The usual framing is three pillars. Metrics give you aggregate trends over time. Logs give you discrete, timestamped events with context. Traces follow a single request across services and show where time went. The pillars matter less than the property they enable - high-cardinality, exploratory analysis. The power comes from being able to keep dimensions like query fingerprint, user ID, table name, and plan hash attached to events instead of averaging them away, then pivoting across those dimensions after the incident has already started.
In a database context the three pillars map cleanly. Metrics are the connection counts, lock waits, and buffer statistics. Logs are the slow query log, autovacuum logs, and error logs, each tied to a statement and a timestamp. Traces capture query execution: which statement ran, how long planning versus execution took, which indexes the planner chose, how the call fits inside the wider request that triggered it. Hold all three at the grain of individual queries and you can ask "which exact statements regressed after Tuesday's deploy, on which tables, for which callers" - a question no preconfigured dashboard was waiting for.
How They Pair
Monitoring and observability are complementary, not competing. The clean division of labor: monitoring detects, observability explains. An alert fires because a threshold tripped - that is monitoring doing its job. You then pivot into the high-cardinality data to find the cause - that is observability doing its job. Take either one away and the loop breaks. Observability without monitoring means nobody notices the problem until customers do. Monitoring without observability means you know something is wrong but spend an hour guessing why.
There is a second pairing worth naming, borrowed from the database guardrails idea and stated generically: push the same instrumentation left. The telemetry that explains a production incident is just as useful before code ships. If you can trace query plans and capture execution metrics in development and CI, you catch the missing index, the accidental sequential scan, or the N+1 pattern while it is cheap to fix, not after it has reached the primary. The signals are the same; you are reading them earlier in the lifecycle. That turns observability from a purely reactive tool into a feedback mechanism developers use while they write the query.
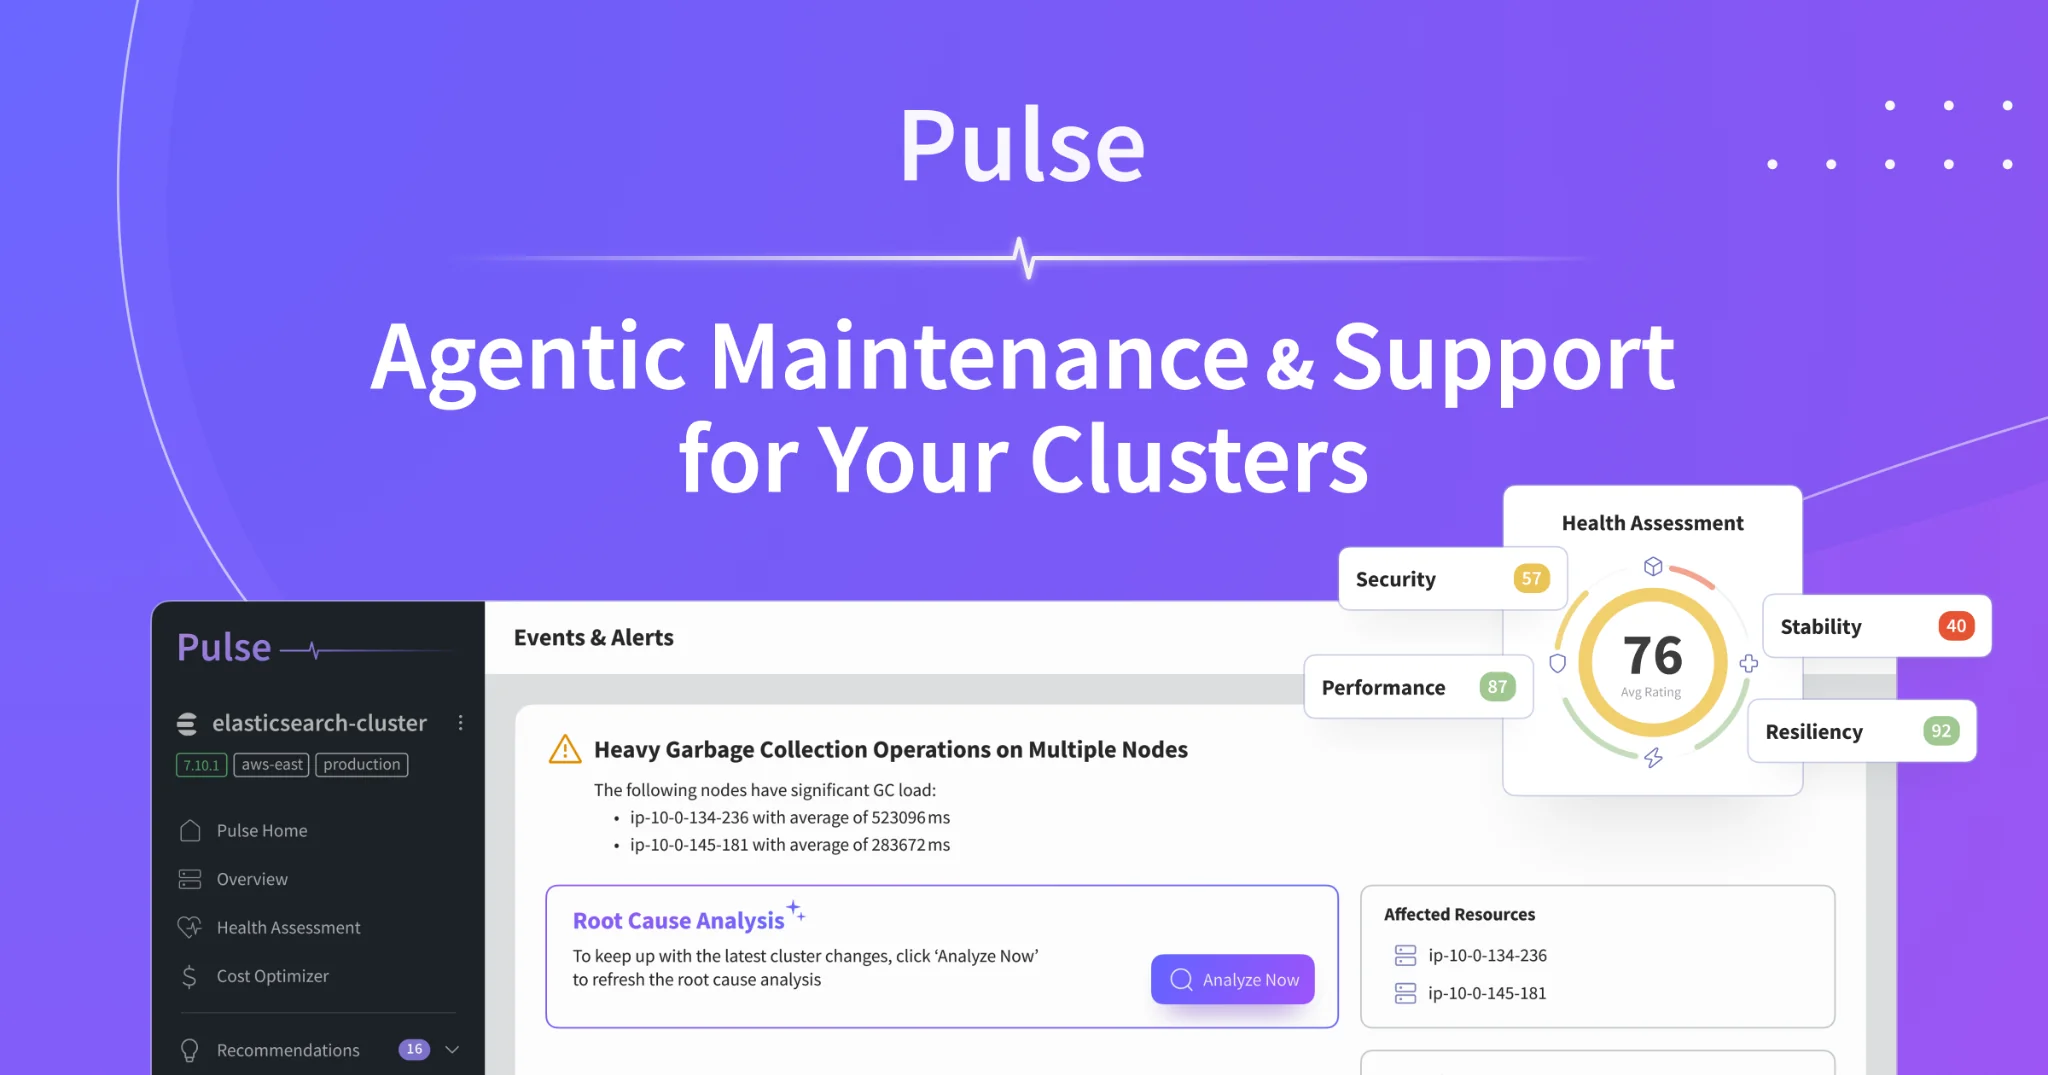
This is where database work gets genuinely hard, because connecting the dots takes context most tools never assemble. A complete explanation looks like "this change merged last week, reached production this morning, the planner stopped using the index, and the table is large enough that the sequential scan now dominates CPU." Stitching deployment history, schema changes, table statistics, and live query traces into that single narrative is the part humans are slow at and the part worth automating. Pulse approaches database observability from this angle: it correlates the three pillars across your databases and runs agentic root-cause analysis, so instead of handing you a chart that shows high CPU, it walks back through the change history, plan shifts, and statistics to tell you what broke and what to do about it. Detection stays the cheap part; explanation is where the time goes, and that is the part it takes off your plate.
Getting the Pairing Right
Start by being honest about which job each tool is doing. If your "observability platform" is really a wall of dashboards with static thresholds, you have monitoring with a fancier name, and you will still be guessing during novel incidents. Real observability is measured by what you can ask after something breaks, not by how many panels you have before it does.
For databases specifically, keep high-cardinality query data instead of throwing it away at ingestion. Per-statement traces with plan hashes, slow query logs tied to statement fingerprints, and table-level statistics over time are what let you answer the unplanned question. Pair that with tight monitoring on the bounded signals - connections, locks, replication lag, cache hit ratio - so detection stays fast. The two together give you a system that tells you the moment something is wrong and lets you find out why without redeploying to add the instrumentation you wish you had.