OpenSearch Monitoring Tool
Modern search infrastructures rely on OpenSearch for scalability, speed, and flexibility - but maintaining cluster performance at scale requires complete visibility. Pulse delivers an intelligent, AI-powered OpenSearch monitoring tool that tracks every node, index, and shard in real time while helping you prevent issues before they happen.
Whether you manage Amazon OpenSearch Service, a self-hosted deployment, or a hybrid setup, Pulse gives you actionable insights into your OpenSearch metrics - helping you monitor, optimize, and scale with confidence.
Optimizing Search and Analytics For Leading Brands

Complete Visibility into OpenSearch Performance
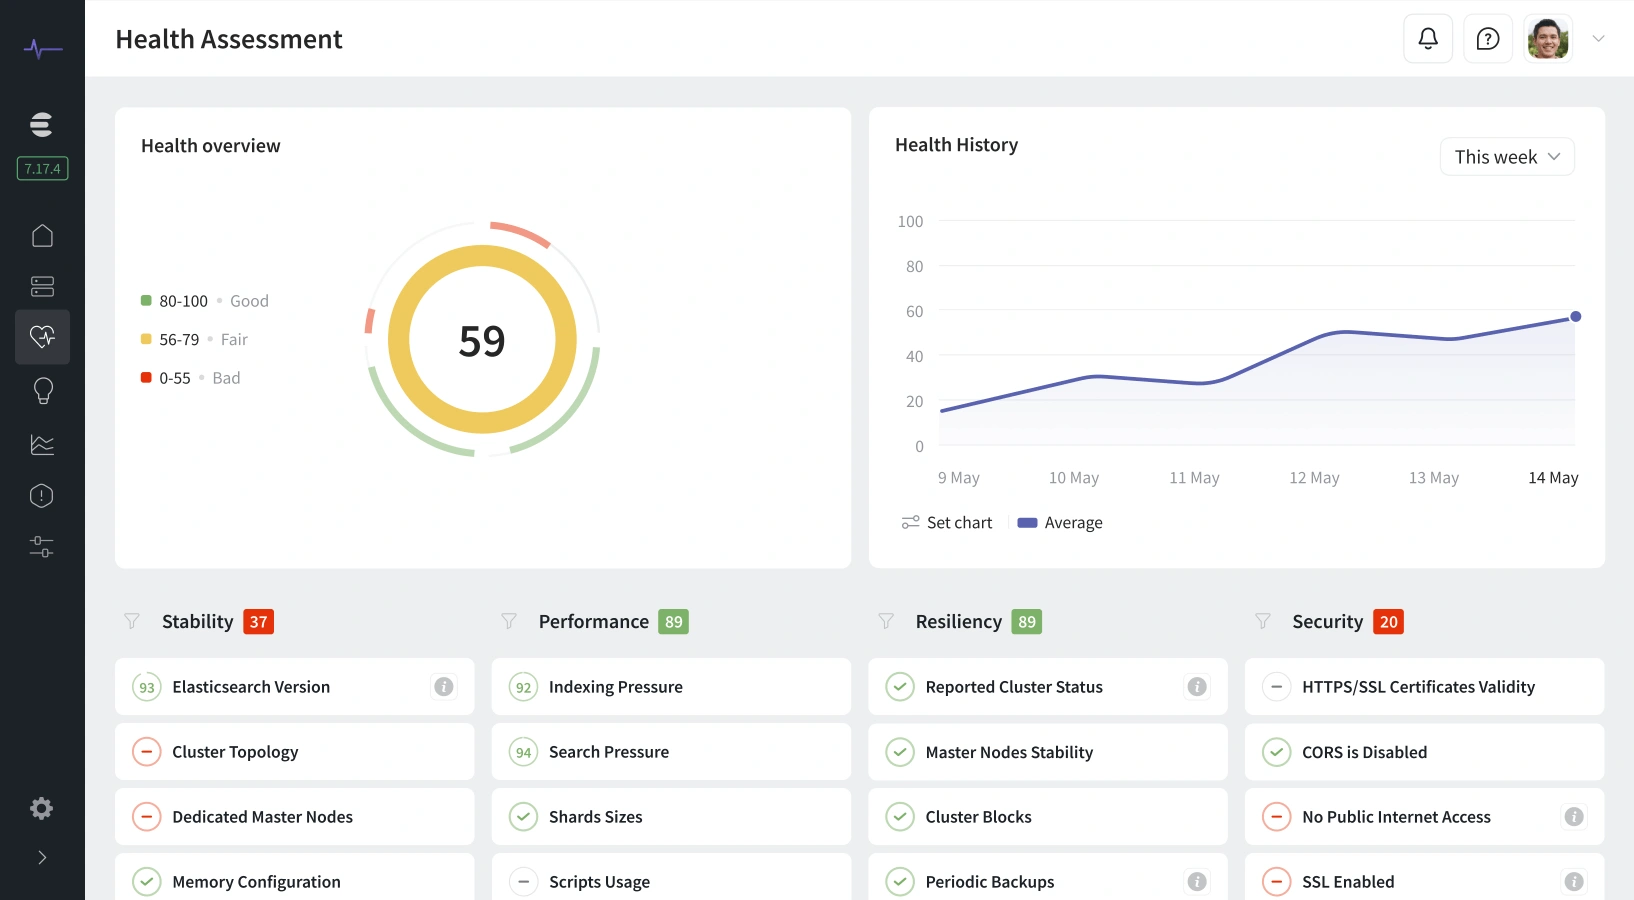
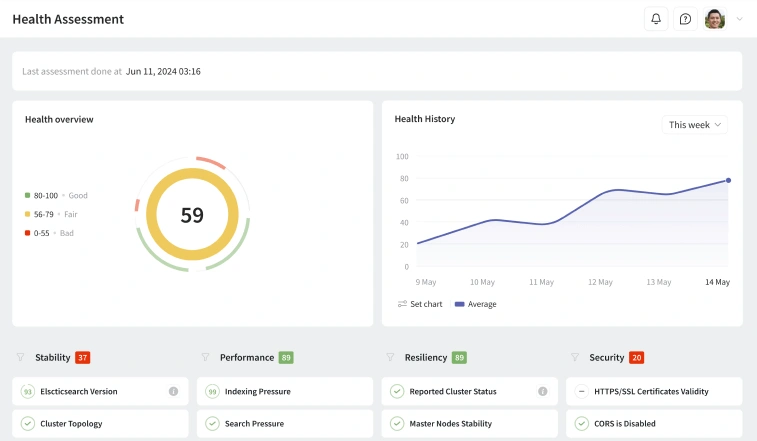
Monitoring OpenSearch effectively means understanding thousands of data points - from shard allocation and index latency to JVM health and query load. Pulse centralizes all that data into clear dashboards so you can instantly see how your clusters are performing and where improvements are needed.
-

Full-Stack Observability:
Pulse connects to your OpenSearch environments across any infrastructure - AWS, Azure, or on-premise - and provides unified visibility into nodes, indices, shards, and system metrics.
-
Detect Issues Before They Escalate:
Stop reacting to outages and start preventing them. Pulse’s proactive analysis spots anomalies in resource usage, query times, or shard imbalance before they disrupt operations.
-
Simplified Cluster Management:
View the real-time health of every component. Identify bottlenecks, rebalance shards, and maintain consistent throughput across all OpenSearch nodes with just a few clicks.
Advanced OpenSearch Metrics Monitoring
Unlike basic monitoring dashboards, Pulse translates raw metrics into insights that drive performance and cost optimization. Our opensearch monitoring tool tracks and correlates metrics across the entire cluster - helping you maintain both speed and stability.
-
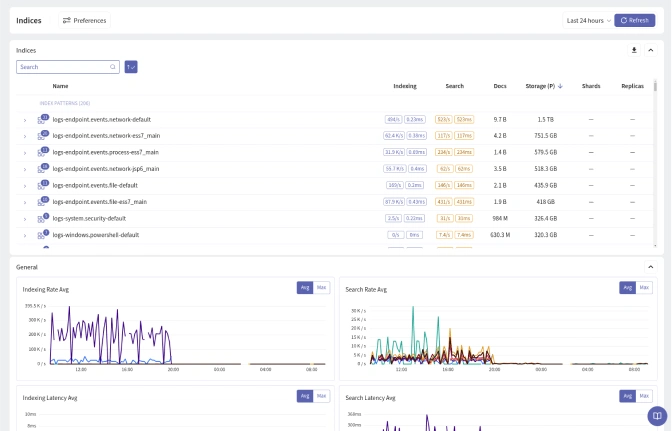
Intelligent Metrics Collection:
Pulse automatically tracks essential OpenSearch metrics such as CPU usage, heap memory, indexing rate, garbage collection, and node availability. You get a full picture of cluster health without the need for complex setup.
-
AI-Assisted Analysis:
Machine learning models analyze historical performance trends, revealing patterns that indicate potential issues - from inefficient queries to unbalanced shard allocation.
-
Performance and Cost Insights:
Monitor OpenSearch efficiency not only for speed but also for cost. Pulse identifies wasted resources and underutilized nodes, enabling you to optimize infrastructure and reduce operating expenses.
Intelligent Alerts and Anomaly Detection
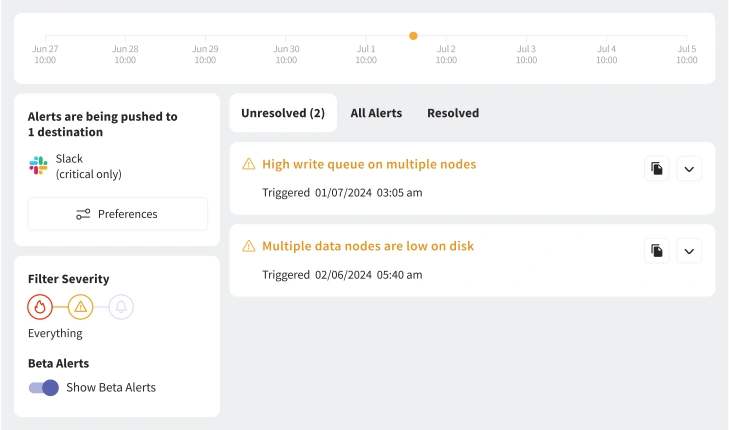
Traditional alerting tools can overwhelm you with constant notifications. Pulse changes that by using context-aware alerts that focus only on what truly matters.
-
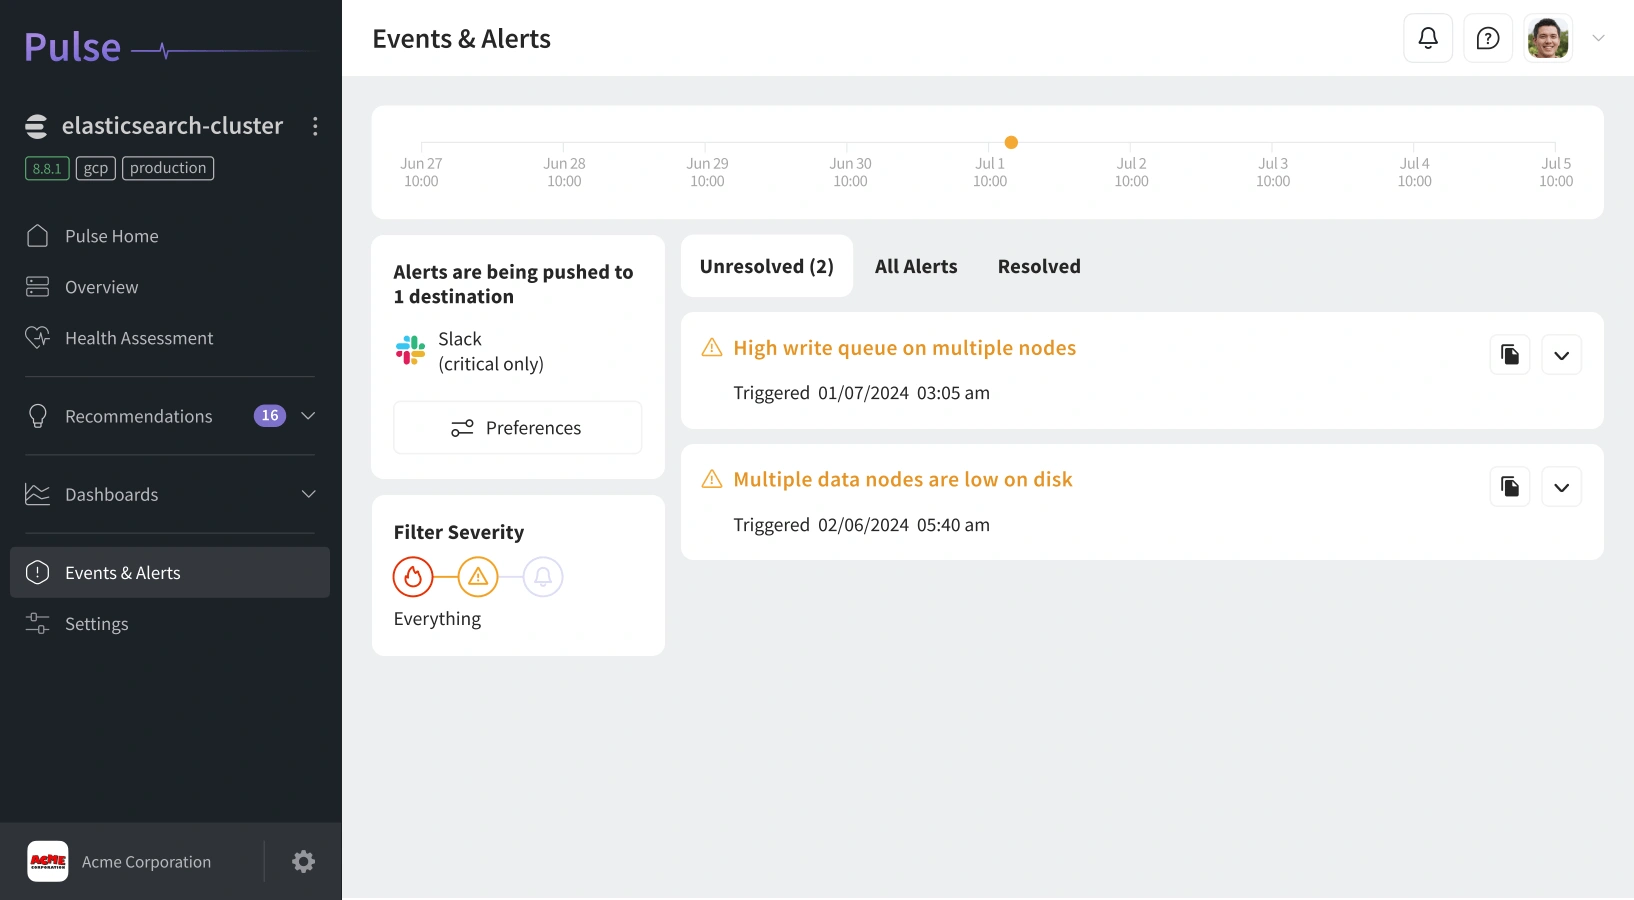
Actionable, Noise-Free Alerts:
Each alert from Pulse includes detailed context: which metric triggered it, its impact, and recommended actions. No spam - only valuable, timely information.
-
Predictive Anomaly Detection:
Our AI engine learns your environment’s normal behavior and predicts deviations before they cause slowdowns or downtime. Pulse helps you fix issues before they become incidents.
-
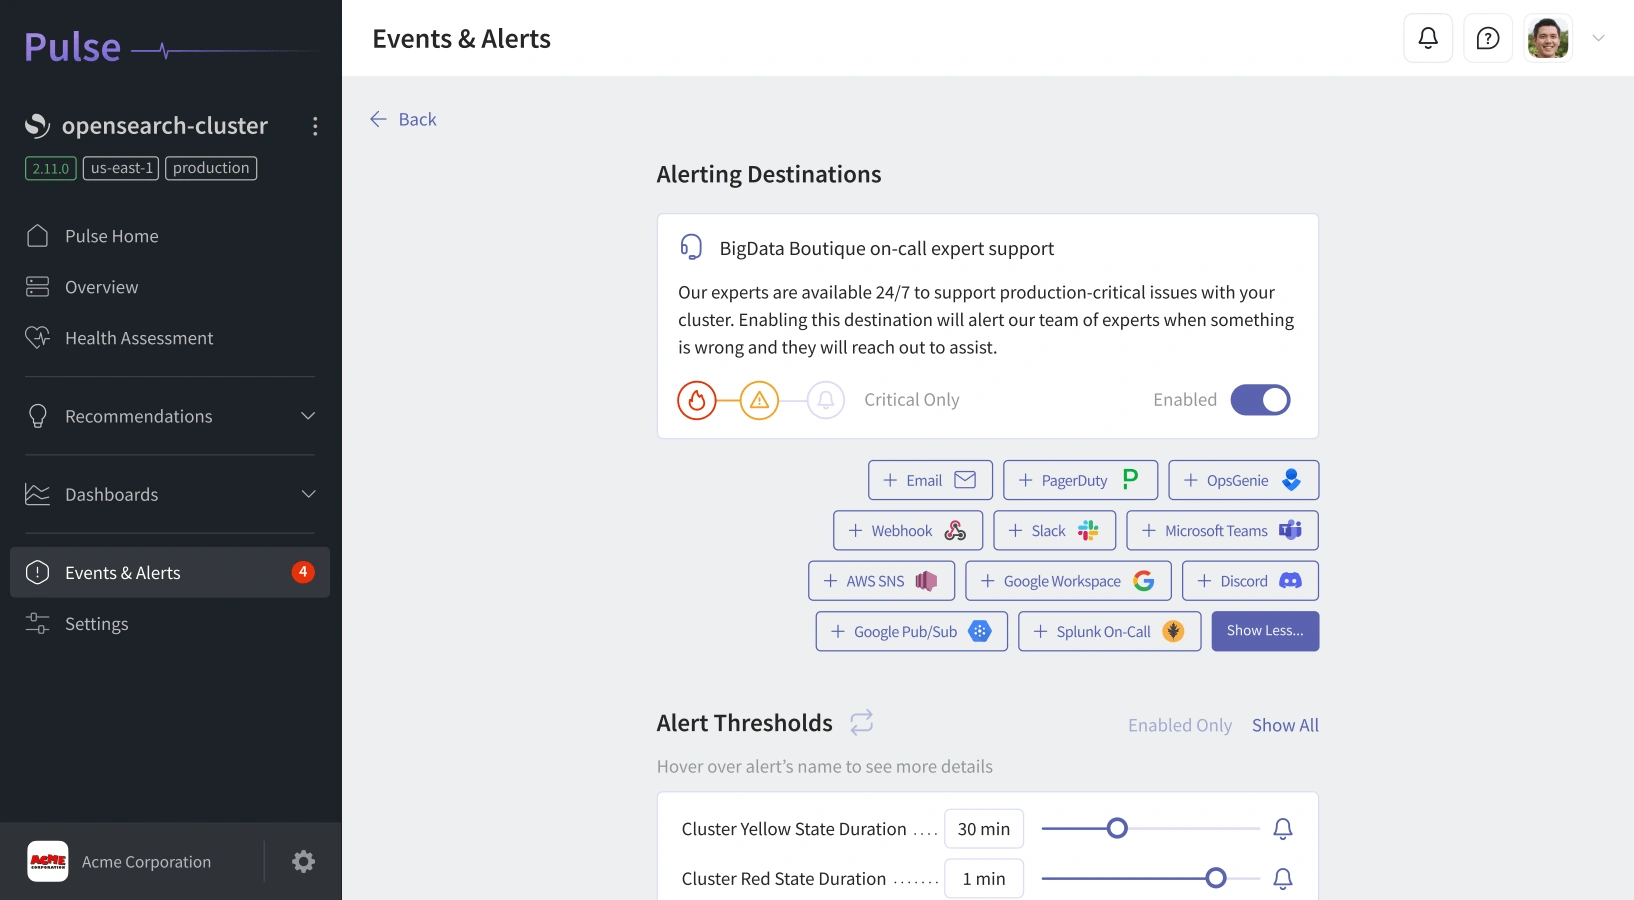
Integrations That Fit Your Workflow:
Receive alerts where your team already works - Slack, Teams, PagerDuty, Datadog, or Discord. Automate responses through RESTful APIs or integrate with your existing monitoring stack.
Actionable Dashboards Built for OpenSearch
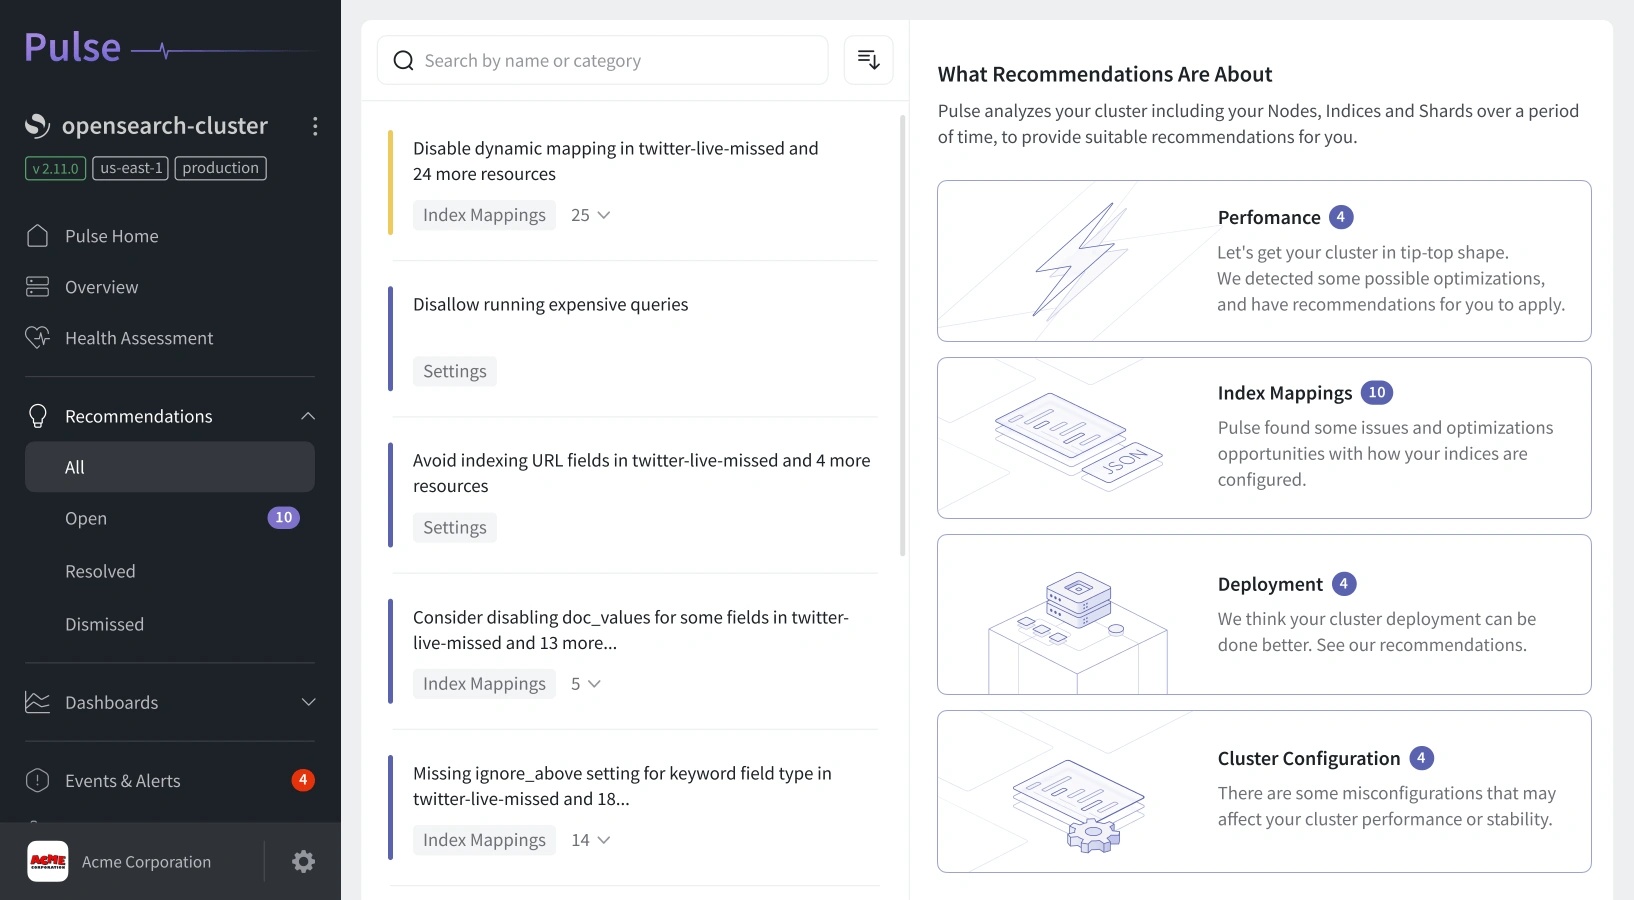
Pulse dashboards aren’t just for visualization - they’re for decision-making. Built by experts who have optimized thousands of clusters, they show what’s happening, why it matters, and how to improve it.
-
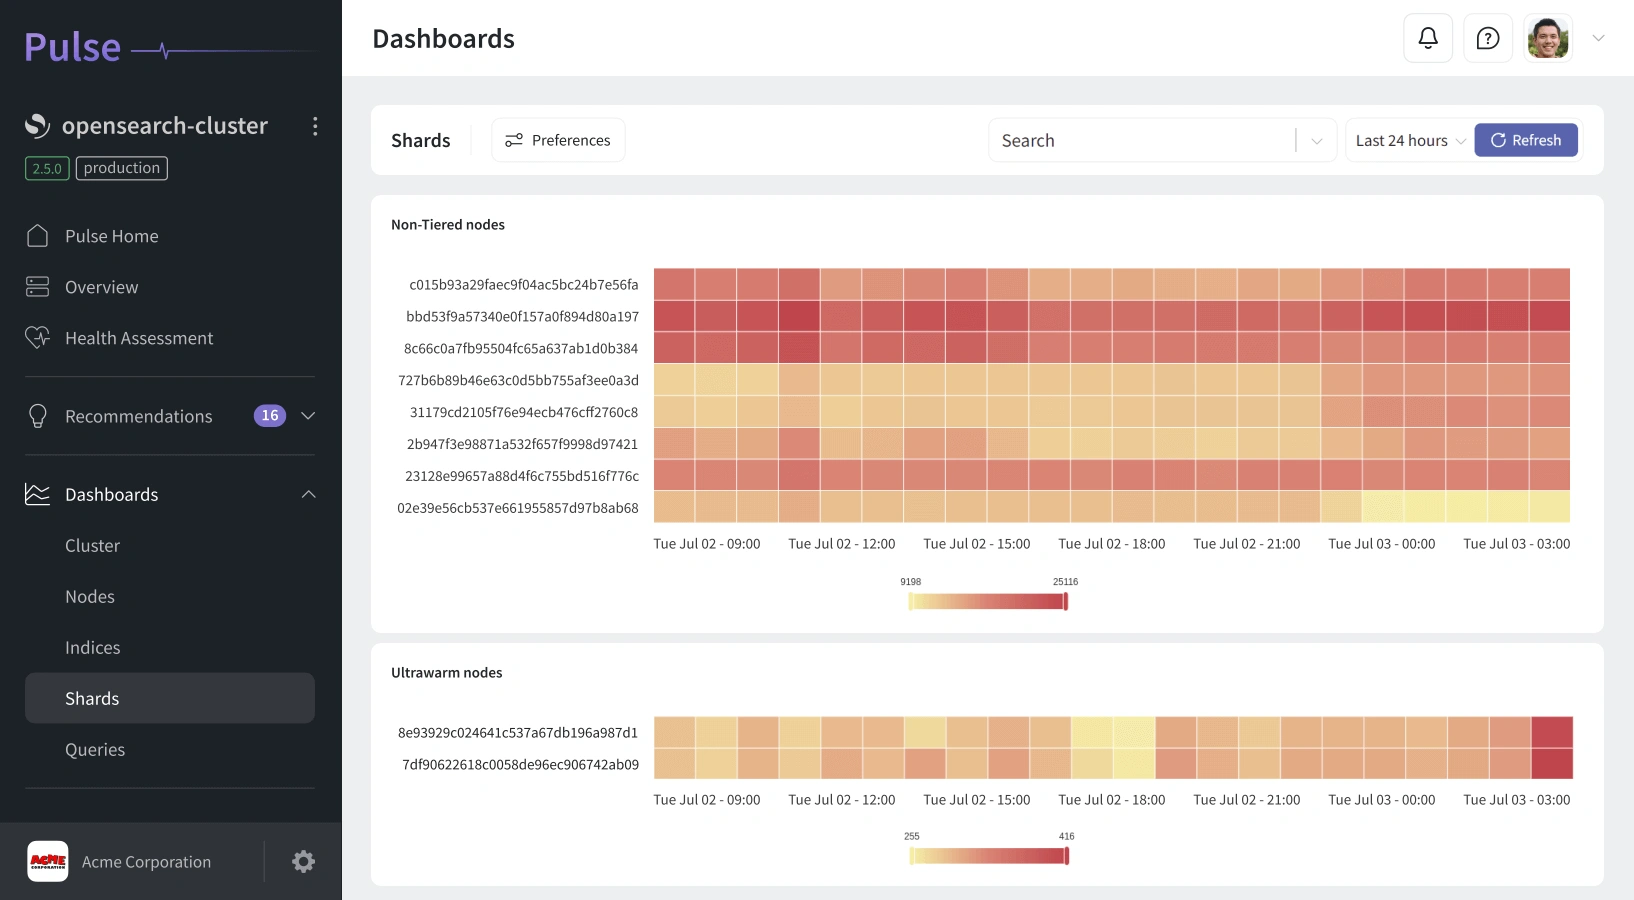
Real-Time Cluster Insights:
Get instant access to metrics like shard status, node utilization, query load, and heap pressure - all visualized in clean, interactive dashboards.
-
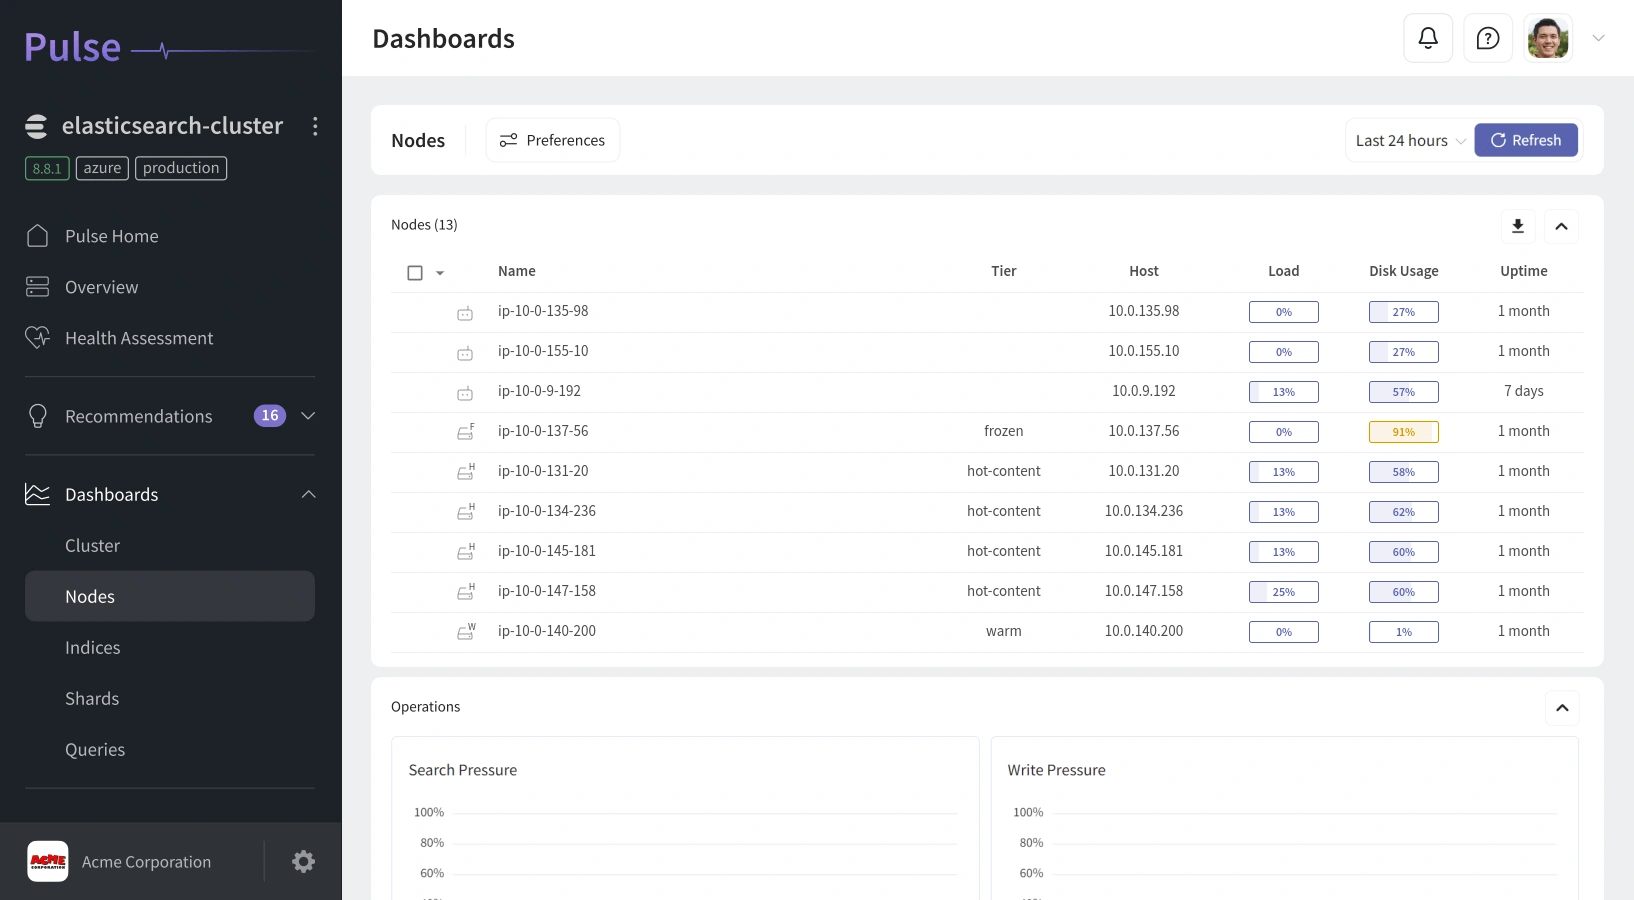
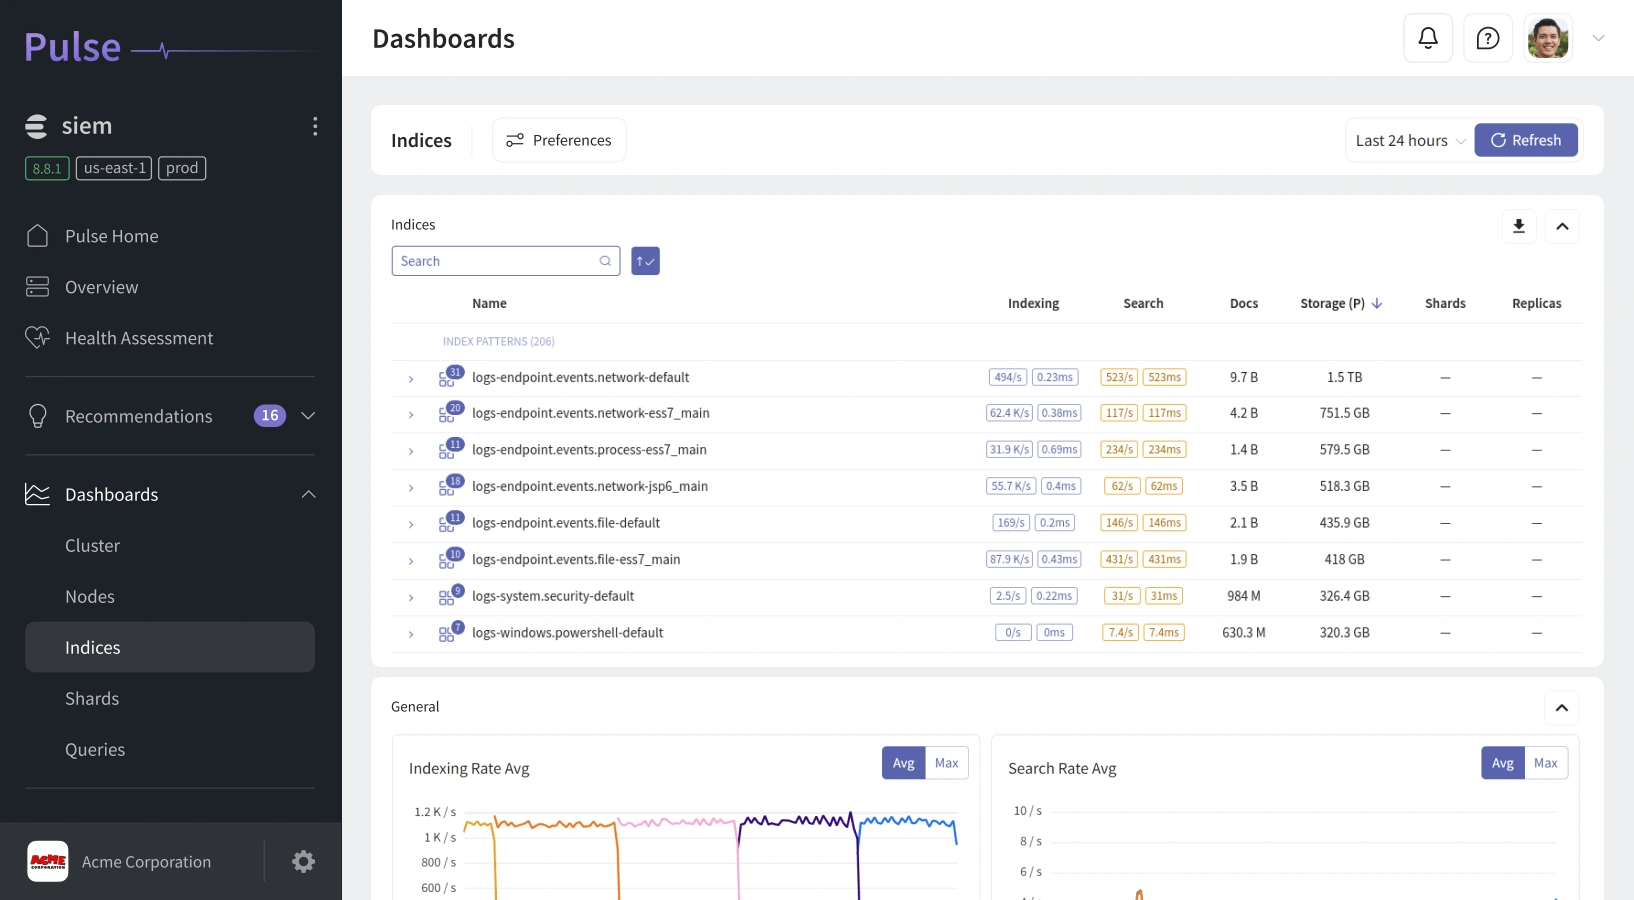
Deep Diagnostic Views:
Drill down from global overviews into individual nodes or indices. See thread pool activity, segment merges, and cache behavior with clarity that standard dashboards can’t match.
-
Built for Engineers and Teams:
Every dashboard was designed by OpenSearch specialists for operational teams. Track performance, investigate spikes, and share insights across departments effortlessly.
Why Choose Pulse for OpenSearch Monitoring
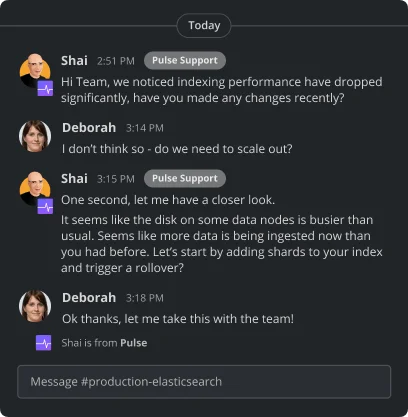
Pulse is more than a tool - it’s an expert partner for managing OpenSearch environments at scale. We combine automation, data intelligence, and real human support to help you maintain stability, performance, and efficiency around the clock.
-
Human Expertise Meets AI Precision:
Our AI detects problems fast, but our experts ensure they’re solved right. You get the perfect balance of intelligent automation and hands-on support.
-
Enterprise-Grade Reliability:
From startups to global enterprises, teams trust Pulse for always-on opensearch monitoring backed by SLAs, 24/7 availability, and proven uptime performance.
-
Continuous Optimization:
Beyond monitoring, Pulse helps improve performance month over month - reducing latency, cutting costs, and ensuring your OpenSearch clusters stay healthy as they grow.
Speak to Our OpenSearch Specialists
Ready to take control of your OpenSearch deployment? Our specialists help you configure monitoring tools, identify what's important to monitor, and optimize every OpenSearch node, index, and shard.
Speak with us today to learn more about OpenSearch and how Pulse helps you monitor in OpenSearch with clarity and confidence.
How to Monitor an OpenSearch Cluster
OpenSearch is a search and analytics engine, not a monitoring system for itself. It exposes a rich set of metrics through APIs — the challenge is collecting, storing, visualizing, and alerting on them continuously. Effective OpenSearch monitoring comes down to watching the right signals and choosing the right method to track them over time.
Key OpenSearch metrics to watch
- Cluster health — the
_cluster/healthAPI returns a green, yellow, or red status and unassigned-shard counts. - Node resources — CPU, JVM heap usage and garbage collection, disk watermarks, and file descriptors via
_nodes/stats. - Shard allocation — unbalanced or unassigned shards that hurt resilience and query speed.
- Indexing & search latency — throughput and p95/p99 latency for write and read paths.
- Thread-pool rejections — an early warning that the cluster is overloaded.
Ways to monitor OpenSearch
Teams typically start with the native APIs and OpenSearch Dashboards, add CloudWatch for Amazon OpenSearch Service, or wire metrics into Prometheus and Grafana. These show the current state but rarely give you history, anomaly detection, or actionable alerts out of the box. A dedicated OpenSearch monitoring tool like Pulse fills that gap — and pairs it with expert OpenSearch support when you need a human in the loop.
FAQ
Is OpenSearch a monitoring tool?
OpenSearch is a search and analytics engine, not a monitoring tool for itself. It exposes cluster, node, and index metrics through APIs (such as _cluster/health and _nodes/stats), but you need a dedicated monitoring tool like Pulse to collect, store, visualize, and alert on those metrics over time.
How do I check the health of an OpenSearch cluster?
The fastest check is the _cluster/health API, which returns a green, yellow, or red status. For ongoing visibility you should track node metrics (CPU, JVM heap, disk), shard allocation, indexing and search latency, and thread-pool rejections. Pulse collects all of these automatically and flags anomalies before they become incidents.
What is an OpenSearch monitoring tool?
An opensearch monitoring tool tracks and analyzes key metrics like node health, shard allocation, and query performance to ensure optimal search speed and cluster stability.
How does Pulse improve OpenSearch monitoring?
Pulse combines AI-driven analytics, proactive alerting, and expert guidance to help teams detect issues early, optimize costs, and maintain consistent performance.
Which OpenSearch metrics does Pulse monitor?
Pulse monitors CPU usage, JVM heap memory, thread pool saturation, index growth, and shard balance - offering complete visibility into cluster operations.
Does Pulse support Amazon OpenSearch Service?
Yes. Pulse integrates seamlessly with Amazon OpenSearch Service, as well as self-managed or hybrid OpenSearch deployments across multiple environments.
Can Pulse help optimize the cost of running OpenSearch?
Absolutely. Pulse identifies inefficient queries, underutilized nodes, and resource waste - helping reduce infrastructure spend without sacrificing performance.