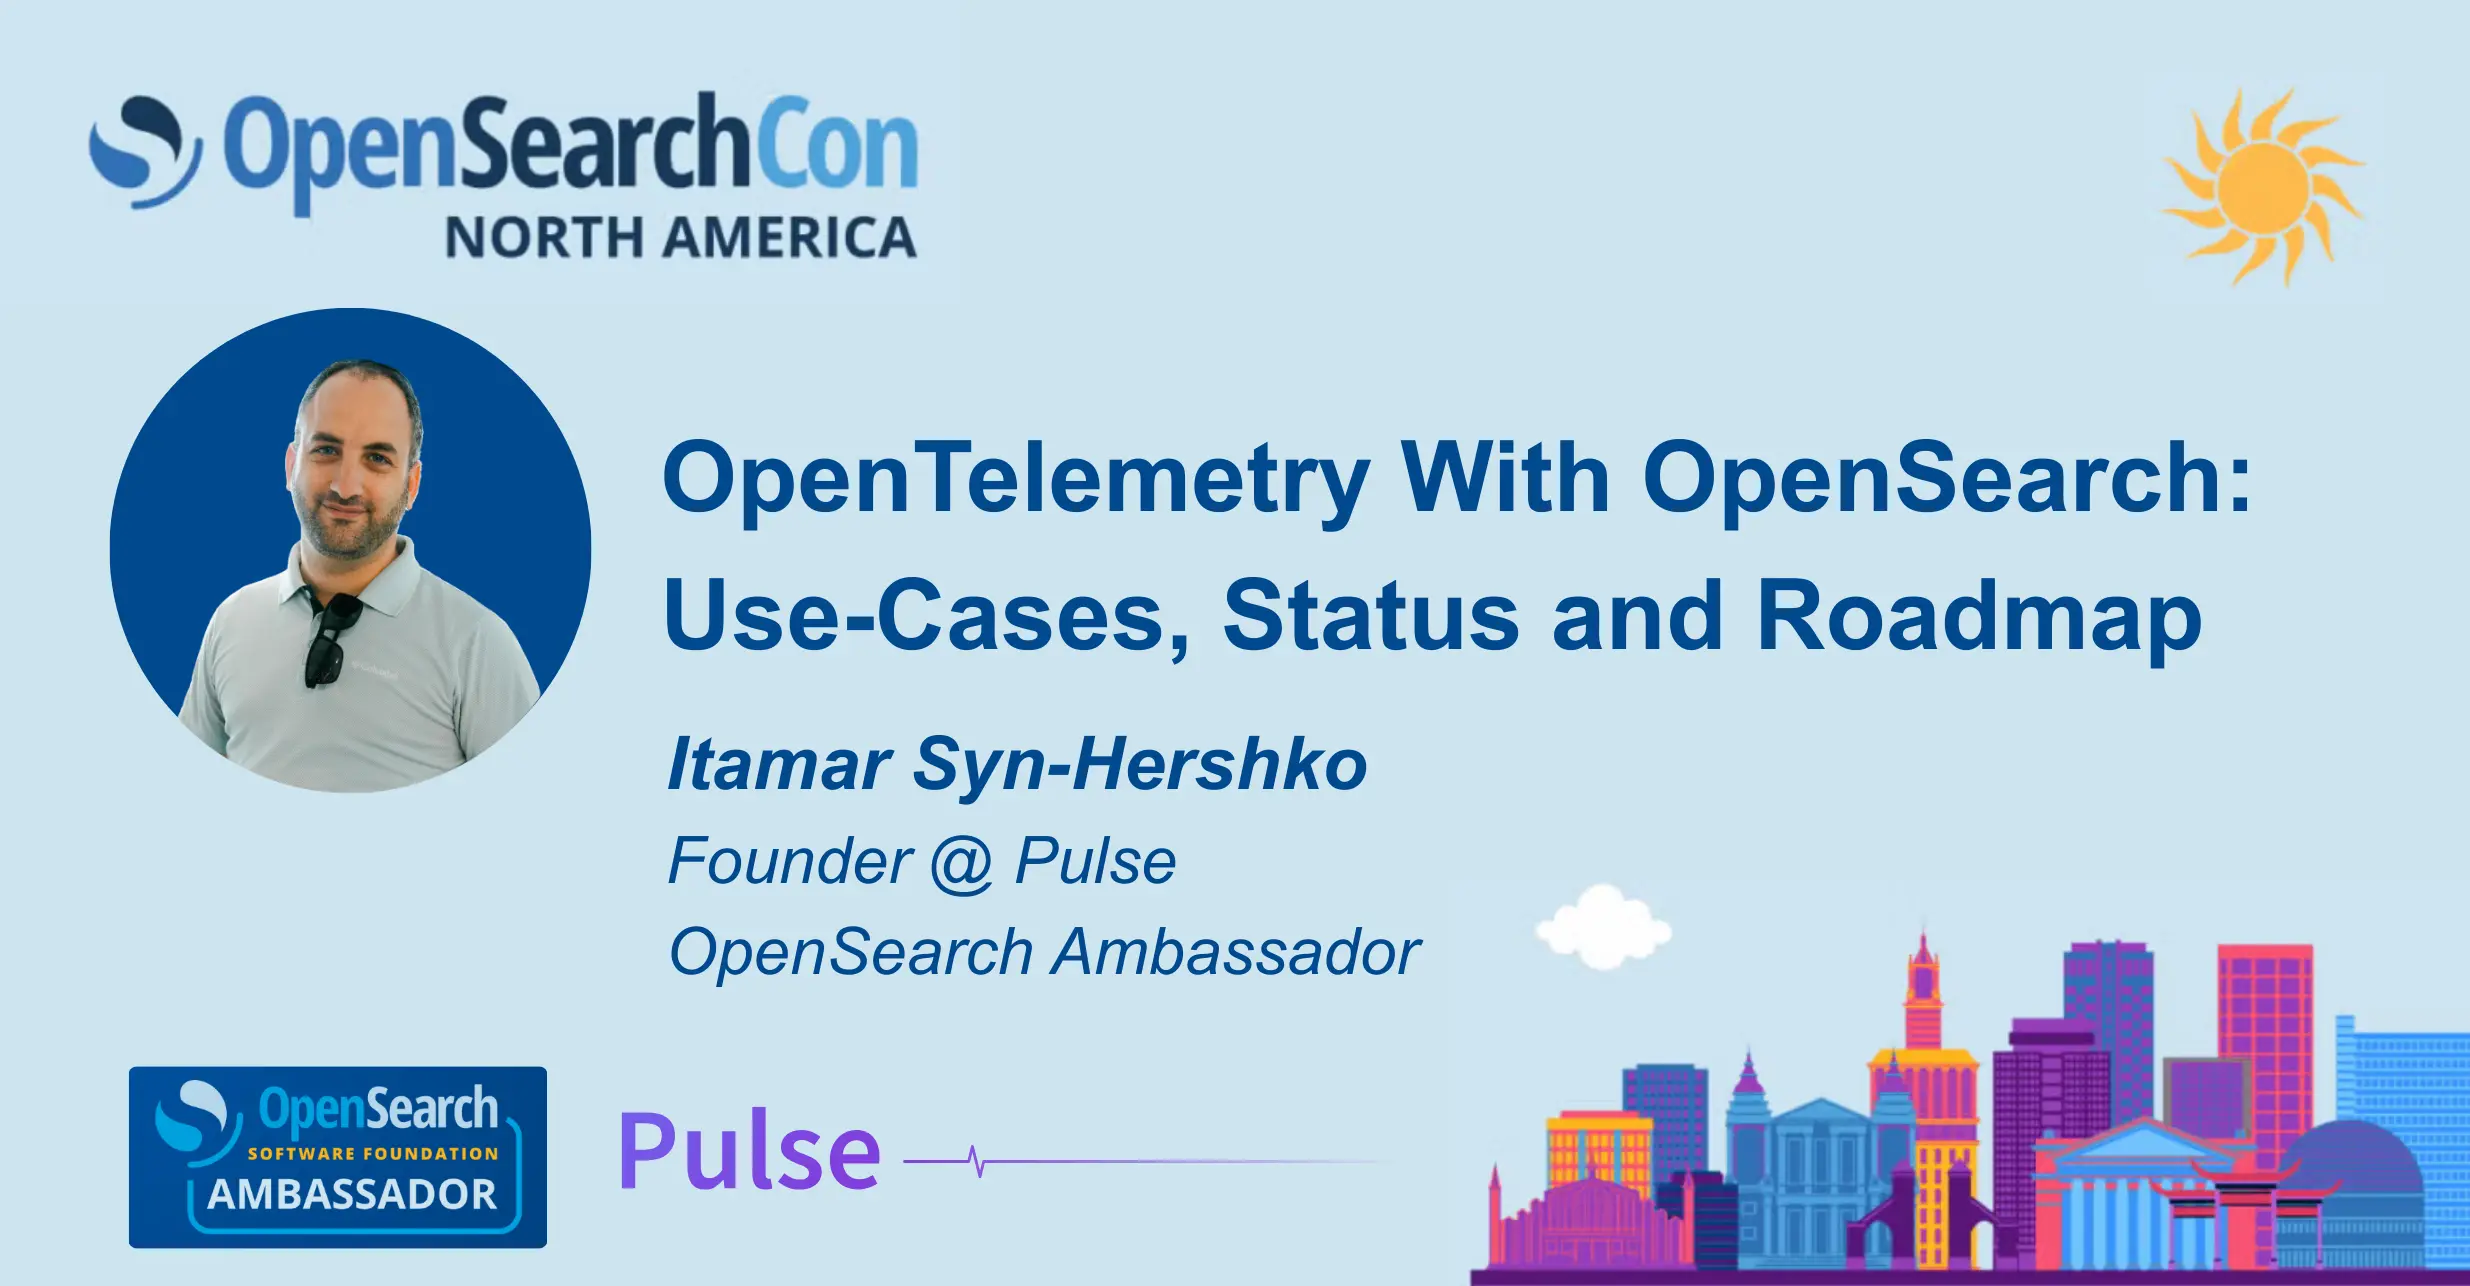
Featured Talk at OpenSearchCon 2025 in San Jose
Pulse founder and CEO Itamar Syn-Hershko was a featured speaker at OpenSearchCon USA 2025 in San Jose. Itamar gave an introduction to OpenTelemetry with OpenSearch called "OpenTelemetry With OpenSearch: Use-Cases, Status and Roadmap".
The key points from Itamar's talk are summarized below.
To watch Itamar's Full talk, click here:

Unlocking Observability with OpenTelemetry and OpenSearch
One of the most exciting evolutions in observability today is OpenTelemetry. In this session, we’ll explore how OpenTelemetry works, why it’s such a game-changer for distributed systems, and how it integrates seamlessly with OpenSearch to deliver actionable insights at scale.
Why OpenTelemetry Matters
Observability has always been critical for understanding the health of modern, distributed applications. Historically, teams have relied on fragmented logging, metrics, and tracing solutions that weren’t standardized or compatible with each other.
OpenTelemetry changes that. It provides a vendor-neutral, open standard for collecting and unifying data across three key pillars of observability:
- Logs: Timestamped records of what happened and when.
- Metrics: Quantitative measurements like latency or throughput over time.
- Traces: End-to-end visibility into requests as they travel across services.
By standardizing these pillars, OpenTelemetry makes it easier to instrument applications, stream data to any backend, and build a cohesive picture of what’s happening across complex systems.
The Challenge with Distributed Systems
Modern applications are inherently distributed. A single user action may trigger multiple API calls, database queries, and downstream processes across dozens of services. Debugging failures in this environment without proper tracing is nearly impossible.
With OpenTelemetry:
- Each unit of work (called a span) is tracked.
- Related spans are grouped into a trace, providing a full end-to-end view of a request.
- Engineers can identify which services are slow, where errors occur, and how dependencies impact performance.
This is especially powerful in serverless architectures, where functions trigger other functions dynamically. Without distributed tracing, diagnosing issues in these environments is like finding a needle in a haystack.
Why Pair OpenTelemetry with OpenSearch
OpenSearch is a natural fit for OpenTelemetry data:
- Proven scalability: Built to handle massive volumes of logs, metrics, and traces at petabyte scale.
- Powerful search and aggregation: Ideal for correlating data across observability pillars.
- Visualization tools: OpenSearch Dashboards provide intuitive views for service maps, trace analytics, and error exploration.
If you’re already using OpenSearch for logging or search workloads, adding OpenTelemetry is straightforward and immediately enhances the value of your existing stack.
Architecture Overview
Here’s how a typical OpenTelemetry + OpenSearch setup works:
1. Instrumentation: Your application emits OpenTelemetry data using SDKs or auto-instrumentation.
- Example: Python libraries can capture database calls, API requests, and service-to-service interactions automatically.
2. Collector: The OpenTelemetry Collector processes and routes data.
- Handles sampling to avoid overwhelming your system.
- Enriches spans with context and metadata.
3. OpenSearch Ingestion: Data flows into OpenSearch via:
- Direct integration from the collector.
- Data Prepper, a Java-based tool designed for advanced processing like building service maps.
4. Dashboards and Analytics: In OpenSearch Dashboards, you can:
- Visualize service dependencies and error rates
- Explore traces, drill into bottlenecks, and verify SLAs.
- Search across logs, metrics, and traces in one unified interface.
Use Cases
OpenTelemetry + OpenSearch powers several high-impact use cases:
- Application Performance Monitoring (APM): Track every user journey and pinpoint slow or failing components.
- Serverless Debugging: Understand the chain of events in serverless workflows that are otherwise opaque.
- Proactive Reliability Management: Continuously verify that services are operating normally and meeting SLAs.
- Root Cause Analysis: Quickly trace a user-reported error back through every touchpoint in your system.
The Role of Data Prepper
Data Prepper is a key component for advanced OpenTelemetry workflows:
- Converts OpenTelemetry data into OpenSearch-compatible formats.
- Builds service maps showing how services interact.
- Handles enrichment, sampling, and routing of telemetry data.
Pro tip: While Data Prepper is currently required for generating service maps, future releases may integrate this functionality directly into OpenSearch.
Example Workflow
Imagine a user reports an error in your application. With OpenTelemetry and OpenSearch:
- Support retrieves the trace ID tied to the error.
- Engineers view the entire user journey in OpenSearch Dashboards.
- They see exactly which service failed, how it cascaded, and what needs fixing.
- No more guessing, no more jumping between tools - just clear, actionable insight.
Getting Started
Here’s how to quickly begin experimenting with OpenTelemetry:
- Install the OpenTelemetry SDK for your language.
- Use auto-instrumentation to capture traces without modifying application code.
- Deploy the OpenTelemetry Collector.
Send data to OpenSearch and start visualizing it in Dashboards.
As you scale, you can customize your setup with features like sampling, enrichment, and multi-cluster management.
The Future of Observability
OpenTelemetry represents a paradigm shift for monitoring. Instead of fragmented, reactive tools, teams now have a unified, proactive system for understanding distributed applications. Combined with OpenSearch’s scalability and analytics power, it’s a winning stack for modern engineering teams.
If you’re already running OpenSearch, adding OpenTelemetry is a natural next step. Try it out, explore the dashboards, and see firsthand how much easier debugging and optimization can be.